
 Yahoo Finance
 As Helios Technologies (NYSE:HLIO) rises 5.5% this past week, investors may now be noticing the company's one-year earnings growth
While it may not be enough for some shareholders, we think it is good to see the Helios Technologies, Inc. (NYSE:HLIO) share price up 11% in a single quarter. But that is minimal compensation for the share price under-performance over the last year. In fact the stock is down 47% in the last year, well below the market return.
While the last year has been tough for Helios Technologies shareholders, this past week has shown signs of promise. So let's look at the longer term fundamentals and see if they've been the driver of the negative returns.
Check out our latest analysis for Helios Technologies
While markets are a powerful pricing mechanism, share prices reflect investor sentiment, not just underlying business performance. One flawed but reasonable way to assess how sentiment around a company has changed is to compare the earnings per share (EPS) with the share price.
Even though the Helios Technologies share price is down over the year, its EPS actually improved. It could be that the share price was previously over-hyped.
The divergence between the EPS and the share price is quite notable, during the year. But we might find some different metrics explain the share price movements better.
Given the yield is quite low, at 0.7%, we doubt the dividend can shed much light on the share price. Helios Technologies managed to grow revenue over the last year, which is usually a real positive. Since the fundamental metrics don't readily explain the share price drop, there might be an opportunity if the market has overreacted.
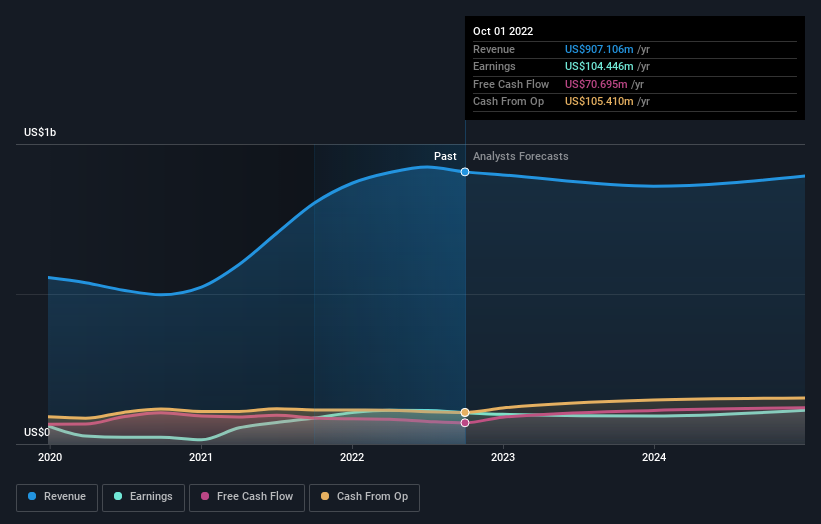
The company's revenue and earnings (over time) are depicted in the image below (click to see the exact numbers).
We know that Helios Technologies has improved its bottom line lately, but what does the future have in store? This free report showing analyst forecasts should help you form a view on Helios Technologies
A Different Perspective
We regret to report that Helios Technologies shareholders are down 47% for the year (even including dividends). Unfortunately, that's worse than the broader market decline of 22%. However, it could simply be that the share price has been impacted by broader market jitters. It might be worth keeping an eye on the fundamentals, in case there's a good opportunity. Regrettably, last year's performance caps off a bad run, with the shareholders facing a total loss of 2% per year over five years. We realise that Baron Rothschild has said investors should "buy when there is blood on the streets", but we caution that investors should first be sure they are buying a high quality business. It's always interesting to track share price performance over the longer term. But to understand Helios Technologies better, we need to consider many other factors. For example, we've discovered 1 warning sign for Helios Technologies that you should be aware of before investing here.
But note: Helios Technologies may not be the best stock to buy. So take a peek at this free list of interesting companies with past earnings growth (and further growth forecast).
Please note, the market returns quoted in this article reflect the market weighted average returns of stocks that currently trade on US exchanges.
Have feedback on this article? Concerned about the content? Get in touch with us directly. Alternatively, email editorial-team (at) simplywallst.com.
This article by Simply Wall St is general in nature. We provide commentary based on historical data and analyst forecasts only using an unbiased methodology and our articles are not intended to be financial advice. It does not constitute a recommendation to buy or sell any stock, and does not take account of your objectives, or your financial situation. We aim to bring you long-term focused analysis driven by fundamental data. Note that our analysis may not factor in the latest price-sensitive company announcements or qualitative material. Simply Wall St has no position in any stocks mentioned.
Join A Paid User Research Session
You’ll receive a US$30 Amazon Gift card for 1 hour of your time while helping us build better investing tools for the individual investors like yourself. Sign up here
