
 Yahoo Finance
 Hazer Group (ASX:HZR) shareholders have earned a 18% CAGR over the last five years
The most you can lose on any stock (assuming you don't use leverage) is 100% of your money. But when you pick a company that is really flourishing, you can make more than 100%. For example, the Hazer Group Limited (ASX:HZR) share price has soared 121% in the last half decade. Most would be very happy with that. On top of that, the share price is up 19% in about a quarter.
So let's investigate and see if the longer term performance of the company has been in line with the underlying business' progress.
View our latest analysis for Hazer Group
Hazer Group isn't currently profitable, so most analysts would look to revenue growth to get an idea of how fast the underlying business is growing. When a company doesn't make profits, we'd generally expect to see good revenue growth. That's because it's hard to be confident a company will be sustainable if revenue growth is negligible, and it never makes a profit.
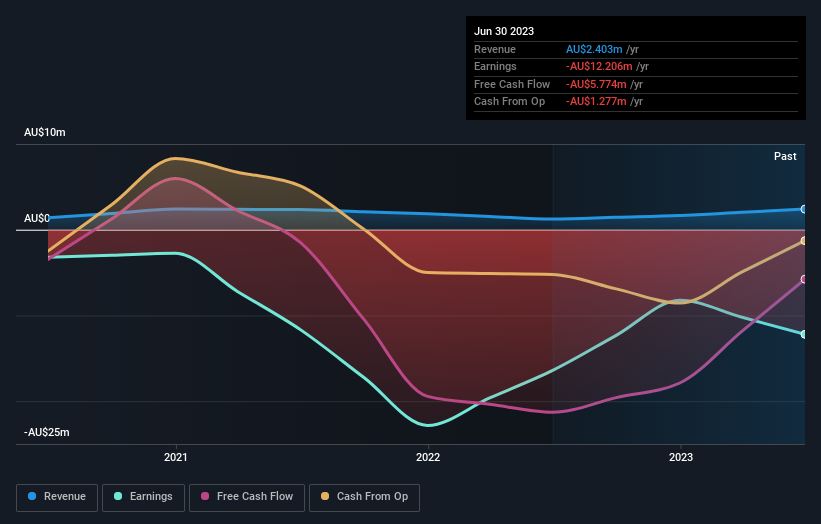
In the last 5 years Hazer Group saw its revenue grow at 12% per year. That's a fairly respectable growth rate. Broadly speaking, this solid progress may well be reflected by the healthy share price gain of 17% per year over five years. It's well worth monitoring the growth trend in revenue, because if growth accelerates, that might signal an opportunity. When a growth trend accelerates, be it in revenue or earnings, it can indicate an inflection point for the business, which is can often be an opportunity for investors.
The company's revenue and earnings (over time) are depicted in the image below (click to see the exact numbers).
We consider it positive that insiders have made significant purchases in the last year. Even so, future earnings will be far more important to whether current shareholders make money. Dive deeper into the earnings by checking this interactive graph of Hazer Group's earnings, revenue and cash flow.
What About The Total Shareholder Return (TSR)?
We'd be remiss not to mention the difference between Hazer Group's total shareholder return (TSR) and its share price return. The TSR attempts to capture the value of dividends (as if they were reinvested) as well as any spin-offs or discounted capital raisings offered to shareholders. Hazer Group hasn't been paying dividends, but its TSR of 127% exceeds its share price return of 121%, implying it has either spun-off a business, or raised capital at a discount; thereby providing additional value to shareholders.
A Different Perspective
Hazer Group shareholders have received returns of 7.7% over twelve months, which isn't far from the general market return. We should note here that the five-year TSR is more impressive, at 18% per year. Although the share price growth has slowed, the longer term story points to a business well worth watching. I find it very interesting to look at share price over the long term as a proxy for business performance. But to truly gain insight, we need to consider other information, too. Take risks, for example - Hazer Group has 5 warning signs (and 2 which don't sit too well with us) we think you should know about.
If you like to buy stocks alongside management, then you might just love this free list of companies. (Hint: insiders have been buying them).
Please note, the market returns quoted in this article reflect the market weighted average returns of stocks that currently trade on Australian exchanges.
Have feedback on this article? Concerned about the content? Get in touch with us directly. Alternatively, email editorial-team (at) simplywallst.com.
This article by Simply Wall St is general in nature. We provide commentary based on historical data and analyst forecasts only using an unbiased methodology and our articles are not intended to be financial advice. It does not constitute a recommendation to buy or sell any stock, and does not take account of your objectives, or your financial situation. We aim to bring you long-term focused analysis driven by fundamental data. Note that our analysis may not factor in the latest price-sensitive company announcements or qualitative material. Simply Wall St has no position in any stocks mentioned.
