
 Yahoo Finance
 Hai Leck Holdings' (SGX:BLH) Returns On Capital Are Heading Higher
If you're looking for a multi-bagger, there's a few things to keep an eye out for. Typically, we'll want to notice a trend of growing return on capital employed (ROCE) and alongside that, an expanding base of capital employed. Ultimately, this demonstrates that it's a business that is reinvesting profits at increasing rates of return. Speaking of which, we noticed some great changes in Hai Leck Holdings' (SGX:BLH) returns on capital, so let's have a look.
Return On Capital Employed (ROCE): What Is It?
For those who don't know, ROCE is a measure of a company's yearly pre-tax profit (its return), relative to the capital employed in the business. To calculate this metric for Hai Leck Holdings, this is the formula:
Return on Capital Employed = Earnings Before Interest and Tax (EBIT) ÷ (Total Assets - Current Liabilities)
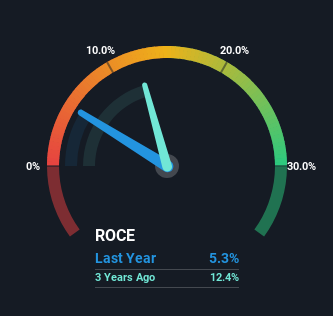
0.053 = S$6.2m ÷ (S$130m - S$12m) (Based on the trailing twelve months to December 2023).
So, Hai Leck Holdings has an ROCE of 5.3%. On its own, that's a low figure but it's around the 5.7% average generated by the Energy Services industry.
See our latest analysis for Hai Leck Holdings
While the past is not representative of the future, it can be helpful to know how a company has performed historically, which is why we have this chart above. If you want to delve into the historical earnings , check out these free graphs detailing revenue and cash flow performance of Hai Leck Holdings.
What Can We Tell From Hai Leck Holdings' ROCE Trend?
Hai Leck Holdings' ROCE growth is quite impressive. More specifically, while the company has kept capital employed relatively flat over the last five years, the ROCE has climbed 201% in that same time. So it's likely that the business is now reaping the full benefits of its past investments, since the capital employed hasn't changed considerably. On that front, things are looking good so it's worth exploring what management has said about growth plans going forward.
What We Can Learn From Hai Leck Holdings' ROCE
As discussed above, Hai Leck Holdings appears to be getting more proficient at generating returns since capital employed has remained flat but earnings (before interest and tax) are up. Since the stock has only returned 25% to shareholders over the last five years, the promising fundamentals may not be recognized yet by investors. So with that in mind, we think the stock deserves further research.
One final note, you should learn about the 3 warning signs we've spotted with Hai Leck Holdings (including 1 which shouldn't be ignored) .
While Hai Leck Holdings isn't earning the highest return, check out this free list of companies that are earning high returns on equity with solid balance sheets.
Have feedback on this article? Concerned about the content? Get in touch with us directly. Alternatively, email editorial-team (at) simplywallst.com.
This article by Simply Wall St is general in nature. We provide commentary based on historical data and analyst forecasts only using an unbiased methodology and our articles are not intended to be financial advice. It does not constitute a recommendation to buy or sell any stock, and does not take account of your objectives, or your financial situation. We aim to bring you long-term focused analysis driven by fundamental data. Note that our analysis may not factor in the latest price-sensitive company announcements or qualitative material. Simply Wall St has no position in any stocks mentioned.
