
 Yahoo Finance
 If You Had Bought Ultra Electronics Holdings (LON:ULE) Shares Three Years Ago You'd Have Earned 35% Returns
One simple way to benefit from the stock market is to buy an index fund. But if you buy good businesses at attractive prices, your portfolio returns could exceed the average market return. Just take a look at Ultra Electronics Holdings plc (LON:ULE), which is up 35%, over three years, soundly beating the market decline of 2.0% (not including dividends). However, more recent returns haven't been as impressive as that, with the stock returning just 13% in the last year , including dividends .
See our latest analysis for Ultra Electronics Holdings
In his essay The Superinvestors of Graham-and-Doddsville Warren Buffett described how share prices do not always rationally reflect the value of a business. One imperfect but simple way to consider how the market perception of a company has shifted is to compare the change in the earnings per share (EPS) with the share price movement.
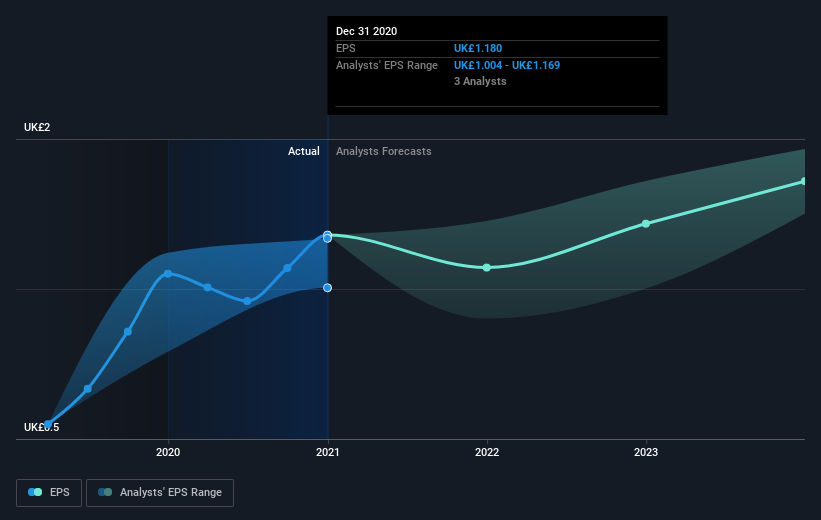
During three years of share price growth, Ultra Electronics Holdings achieved compound earnings per share growth of 21% per year. This EPS growth is higher than the 10% average annual increase in the share price. So one could reasonably conclude that the market has cooled on the stock.
You can see below how EPS has changed over time (discover the exact values by clicking on the image).
It's probably worth noting we've seen significant insider buying in the last quarter, which we consider a positive. On the other hand, we think the revenue and earnings trends are much more meaningful measures of the business. Dive deeper into the earnings by checking this interactive graph of Ultra Electronics Holdings' earnings, revenue and cash flow.
What About Dividends?
When looking at investment returns, it is important to consider the difference between total shareholder return (TSR) and share price return. Whereas the share price return only reflects the change in the share price, the TSR includes the value of dividends (assuming they were reinvested) and the benefit of any discounted capital raising or spin-off. So for companies that pay a generous dividend, the TSR is often a lot higher than the share price return. In the case of Ultra Electronics Holdings, it has a TSR of 46% for the last 3 years. That exceeds its share price return that we previously mentioned. The dividends paid by the company have thusly boosted the total shareholder return.
A Different Perspective
Ultra Electronics Holdings shareholders are up 13% for the year (even including dividends). Unfortunately this falls short of the market return. The silver lining is that the gain was actually better than the average annual return of 6% per year over five year. This could indicate that the company is winning over new investors, as it pursues its strategy. It is all well and good that insiders have been buying shares, but we suggest you check here to see what price insiders were buying at.
If you like to buy stocks alongside management, then you might just love this free list of companies. (Hint: insiders have been buying them).
Please note, the market returns quoted in this article reflect the market weighted average returns of stocks that currently trade on GB exchanges.
This article by Simply Wall St is general in nature. It does not constitute a recommendation to buy or sell any stock, and does not take account of your objectives, or your financial situation. We aim to bring you long-term focused analysis driven by fundamental data. Note that our analysis may not factor in the latest price-sensitive company announcements or qualitative material. Simply Wall St has no position in any stocks mentioned.
Have feedback on this article? Concerned about the content? Get in touch with us directly. Alternatively, email editorial-team (at) simplywallst.com.
