
 Yahoo Finance
 If You Had Bought Cellnet Group (ASX:CLT) Shares Three Years Ago You'd Have A Total Return Of Negative 36%
It is doubtless a positive to see that the Cellnet Group Limited (ASX:CLT) share price has gained some 62% in the last three months. But that cannot eclipse the less-than-impressive returns over the last three years. Truth be told the share price declined 71% in three years and that return, Dear Reader, falls short of what you could have got from passive investing with an index fund.
View our latest analysis for Cellnet Group
In his essay The Superinvestors of Graham-and-Doddsville Warren Buffett described how share prices do not always rationally reflect the value of a business. One flawed but reasonable way to assess how sentiment around a company has changed is to compare the earnings per share (EPS) with the share price.
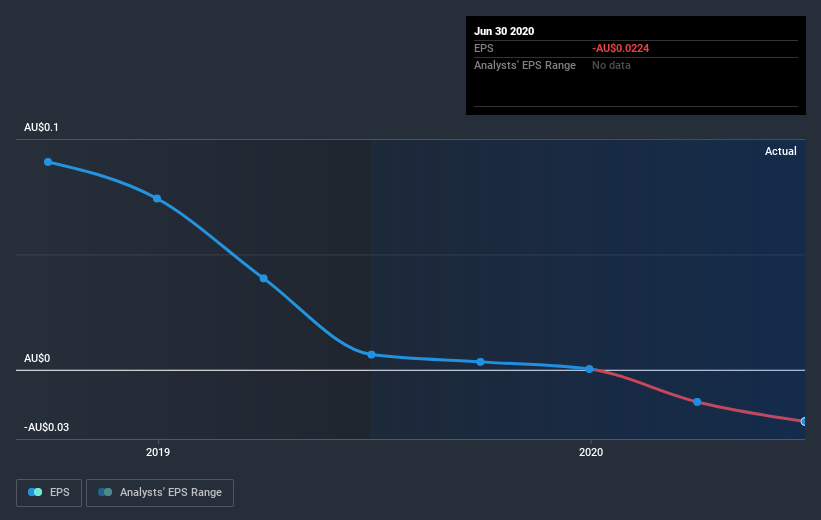
Over the three years that the share price declined, Cellnet Group's earnings per share (EPS) dropped significantly, falling to a loss. Since the company has fallen to a loss making position, it's hard to compare the change in EPS with the share price change. However, we can say we'd expect to see a falling share price in this scenario.
The company's earnings per share (over time) is depicted in the image below (click to see the exact numbers).
We like that insiders have been buying shares in the last twelve months. Having said that, most people consider earnings and revenue growth trends to be a more meaningful guide to the business. Before buying or selling a stock, we always recommend a close examination of historic growth trends, available here..
What about the Total Shareholder Return (TSR)?
Investors should note that there's a difference between Cellnet Group's total shareholder return (TSR) and its share price change, which we've covered above. The TSR attempts to capture the value of dividends (as if they were reinvested) as well as any spin-offs or discounted capital raisings offered to shareholders. Cellnet Group's TSR of was a loss of 36% for the 3 years. That wasn't as bad as its share price return, because it has paid dividends.
A Different Perspective
It's nice to see that Cellnet Group shareholders have received a total shareholder return of 36% over the last year. Since the one-year TSR is better than the five-year TSR (the latter coming in at 6% per year), it would seem that the stock's performance has improved in recent times. Someone with an optimistic perspective could view the recent improvement in TSR as indicating that the business itself is getting better with time. It's always interesting to track share price performance over the longer term. But to understand Cellnet Group better, we need to consider many other factors. Even so, be aware that Cellnet Group is showing 5 warning signs in our investment analysis , and 2 of those are a bit unpleasant...
If you like to buy stocks alongside management, then you might just love this free list of companies. (Hint: insiders have been buying them).
Please note, the market returns quoted in this article reflect the market weighted average returns of stocks that currently trade on AU exchanges.
This article by Simply Wall St is general in nature. It does not constitute a recommendation to buy or sell any stock, and does not take account of your objectives, or your financial situation. We aim to bring you long-term focused analysis driven by fundamental data. Note that our analysis may not factor in the latest price-sensitive company announcements or qualitative material. Simply Wall St has no position in any stocks mentioned.
Have feedback on this article? Concerned about the content? Get in touch with us directly. Alternatively, email editorial-team (at) simplywallst.com.
