
 Yahoo Finance
 Are GWA Group Limited's (ASX:GWA) Mixed Financials The Reason For Its Gloomy Performance on The Stock Market?
It is hard to get excited after looking at GWA Group's (ASX:GWA) recent performance, when its stock has declined 8.1% over the past month. We, however decided to study the company's financials to determine if they have got anything to do with the price decline. Stock prices are usually driven by a company’s financial performance over the long term, and therefore we decided to pay more attention to the company's financial performance. Particularly, we will be paying attention to GWA Group's ROE today.
Return on equity or ROE is a key measure used to assess how efficiently a company's management is utilizing the company's capital. In other words, it is a profitability ratio which measures the rate of return on the capital provided by the company's shareholders.
See our latest analysis for GWA Group
How To Calculate Return On Equity?
The formula for ROE is:
Return on Equity = Net Profit (from continuing operations) ÷ Shareholders' Equity
So, based on the above formula, the ROE for GWA Group is:
15% = AU$45m ÷ AU$307m (Based on the trailing twelve months to December 2023).
The 'return' is the income the business earned over the last year. Another way to think of that is that for every A$1 worth of equity, the company was able to earn A$0.15 in profit.
What Is The Relationship Between ROE And Earnings Growth?
So far, we've learned that ROE is a measure of a company's profitability. Depending on how much of these profits the company reinvests or "retains", and how effectively it does so, we are then able to assess a company’s earnings growth potential. Generally speaking, other things being equal, firms with a high return on equity and profit retention, have a higher growth rate than firms that don’t share these attributes.
GWA Group's Earnings Growth And 15% ROE
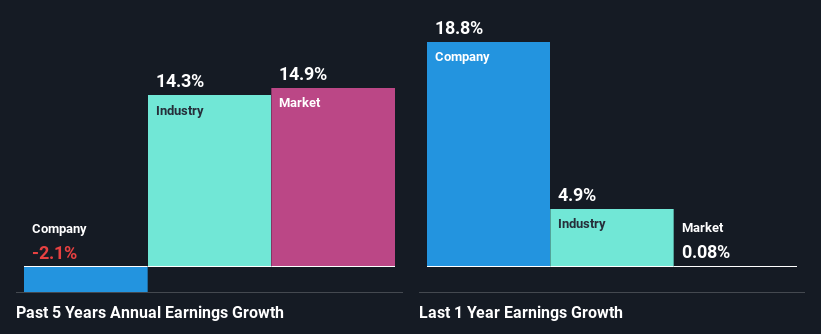
At first glance, GWA Group seems to have a decent ROE. Especially when compared to the industry average of 11% the company's ROE looks pretty impressive. For this reason, GWA Group's five year net income decline of 2.1% raises the question as to why the high ROE didn't translate into earnings growth. We reckon that there could be some other factors at play here that are preventing the company's growth. Such as, the company pays out a huge portion of its earnings as dividends, or is faced with competitive pressures.
That being said, we compared GWA Group's performance with the industry and were concerned when we found that while the company has shrunk its earnings, the industry has grown its earnings at a rate of 14% in the same 5-year period.
Earnings growth is an important metric to consider when valuing a stock. It’s important for an investor to know whether the market has priced in the company's expected earnings growth (or decline). This then helps them determine if the stock is placed for a bright or bleak future. Has the market priced in the future outlook for GWA? You can find out in our latest intrinsic value infographic research report.
Is GWA Group Making Efficient Use Of Its Profits?
GWA Group's declining earnings is not surprising given how the company is spending most of its profits in paying dividends, judging by its three-year median payout ratio of 94% (or a retention ratio of 5.8%). With only very little left to reinvest into the business, growth in earnings is far from likely.
In addition, GWA Group has been paying dividends over a period of at least ten years suggesting that keeping up dividend payments is way more important to the management even if it comes at the cost of business growth. Our latest analyst data shows that the future payout ratio of the company over the next three years is expected to be approximately 80%. Therefore, the company's future ROE is also not expected to change by much with analysts predicting an ROE of 16%.
Summary
In total, we're a bit ambivalent about GWA Group's performance. Despite the high ROE, the company has a disappointing earnings growth number, due to its poor rate of reinvestment into its business. Having said that, looking at current analyst estimates, we found that the company's earnings growth rate is expected to see a huge improvement. To know more about the latest analysts predictions for the company, check out this visualization of analyst forecasts for the company.
Have feedback on this article? Concerned about the content? Get in touch with us directly. Alternatively, email editorial-team (at) simplywallst.com.
This article by Simply Wall St is general in nature. We provide commentary based on historical data and analyst forecasts only using an unbiased methodology and our articles are not intended to be financial advice. It does not constitute a recommendation to buy or sell any stock, and does not take account of your objectives, or your financial situation. We aim to bring you long-term focused analysis driven by fundamental data. Note that our analysis may not factor in the latest price-sensitive company announcements or qualitative material. Simply Wall St has no position in any stocks mentioned.
