
 Yahoo Finance
 Gruma SAB de CV's Dividend Analysis
An In-Depth Look at Gruma SAB de CV's Upcoming Dividend and Its Historical Performance
Gruma SAB de CV (GPAGF) recently announced a dividend of $0.08 per share, payable on 2023-12-29, with the ex-dividend date set for 2023-12-27. As investors look forward to this upcoming payment, the spotlight also shines on the company's dividend history, yield, and growth rates. Using the data from GuruFocus, let's look into Gruma SAB de CVs dividend performance and assess its sustainability.
What Does Gruma SAB de CV Do?
This Powerful Chart Made Peter Lynch 29% A Year For 13 Years
How to calculate the intrinsic value of a stock?
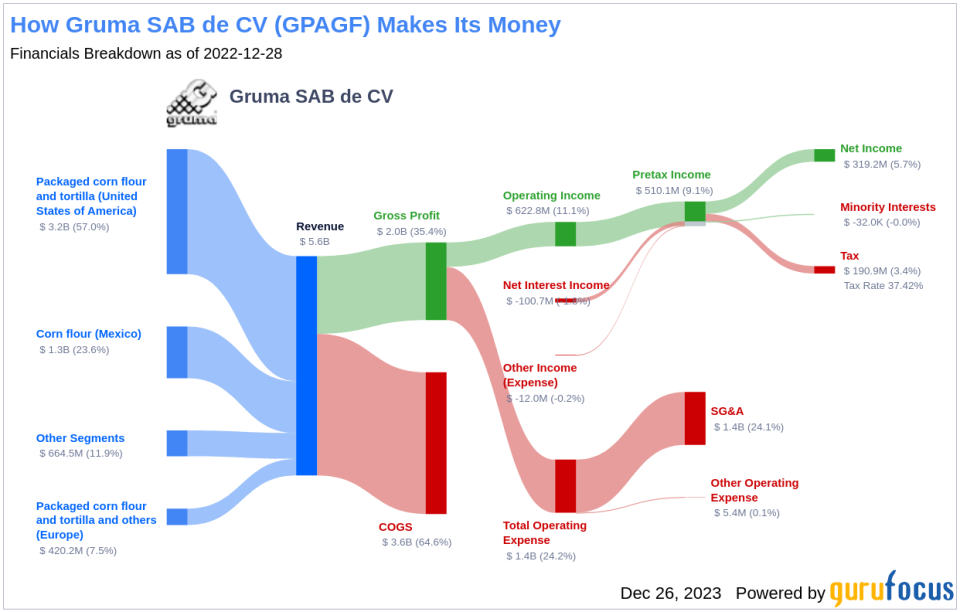
Gruma SAB de CV is an international food production company, originally from Mexico. The product portfolio is large: corn and flour tortillas, wheat flour, naan, pita bread, flatbreads, wraps, chapatti, and pizza bases, along with other food products, such as snacks, pasta, rice, condiments, and palm hearts. The company has operations in America, Europe, Asia, and Oceania, and is present in over 100 countries across the globe. Its well-known brands are Maseca, Robin Hood, Mission, Guerrero, Tortiricas and Tosty.
A Glimpse at Gruma SAB de CV's Dividend History
Gruma SAB de CV has maintained a consistent dividend payment record since 2014. Dividends are currently distributed on a yearly basis. Below is a chart showing annual Dividends Per Share for tracking historical trends.

Breaking Down Gruma SAB de CV's Dividend Yield and Growth
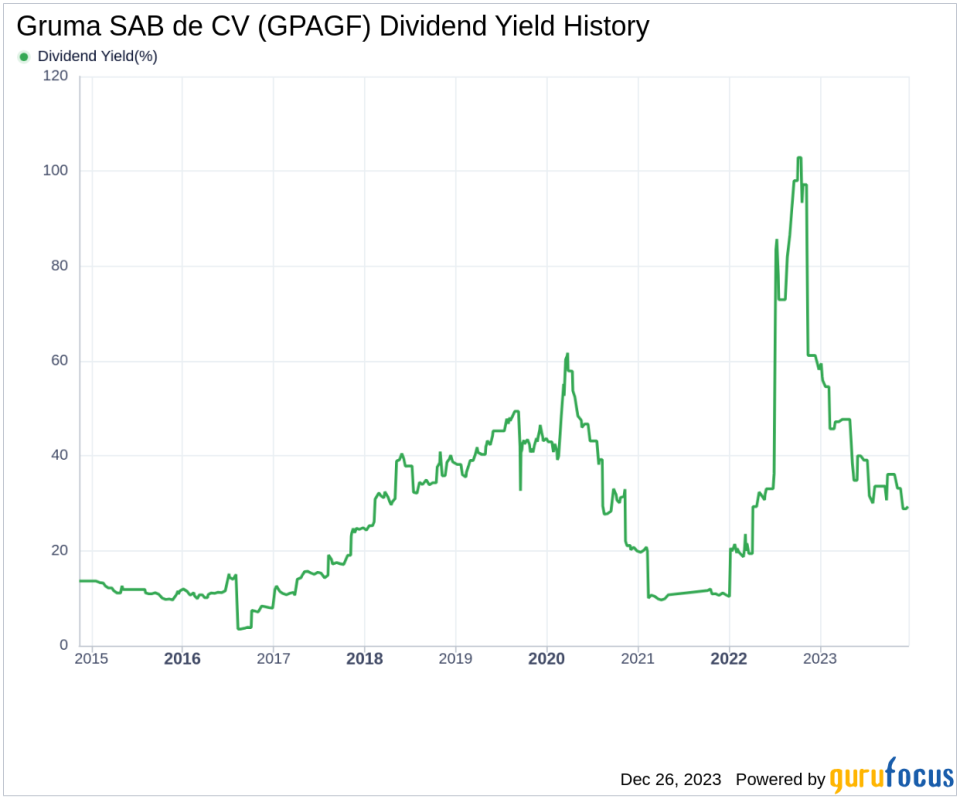
As of today, Gruma SAB de CV currently has a 12-month trailing dividend yield of 1.72% and a 12-month forward dividend yield of 1.75%. This suggests an expectation of increased dividend payments over the next 12 months. Over the past three years, Gruma SAB de CV's annual dividend growth rate was 13.50%. Extended to a five-year horizon, this rate decreased to 13.30% per year. Based on Gruma SAB de CV's dividend yield and five-year growth rate, the 5-year yield on cost of Gruma SAB de CV stock as of today is approximately 3.21%.
The Sustainability Question: Payout Ratio and Profitability
To assess the sustainability of the dividend, one needs to evaluate the company's payout ratio. The dividend payout ratio provides insights into the portion of earnings the company distributes as dividends. A lower ratio suggests that the company retains a significant part of its earnings, thereby ensuring the availability of funds for future growth and unexpected downturns. As of 2023-09-30, Gruma SAB de CV's dividend payout ratio is 0.29. Gruma SAB de CV's profitability rank, offers an understanding of the company's earnings prowess relative to its peers. GuruFocus ranks Gruma SAB de CV's profitability 9 out of 10 as of 2023-09-30, suggesting good profitability prospects. The company has reported positive net income for each of year over the past decade, further solidifying its high profitability.
Growth Metrics: The Future Outlook
To ensure the sustainability of dividends, a company must have robust growth metrics. Gruma SAB de CV's growth rank of 9 out of 10 suggests that the company's growth trajectory is good relative to its competitors. Revenue is the lifeblood of any company, and Gruma SAB de CV's revenue per share, combined with the 3-year revenue growth rate, indicates a strong revenue model. Gruma SAB de CV's revenue has increased by approximately 16.30% per year on average, a rate that outperforms approximately 76% of global competitors. The company's 3-year EPS growth rate showcases its capability to grow its earnings, a critical component for sustaining dividends in the long run. During the past three years, Gruma SAB de CV's earnings increased by approximately 13.00% per year on average, a rate that outperforms approximately 56.9% of global competitors. Lastly, the company's 5-year EBITDA growth rate of 3.60%, which outperforms approximately 45.38% of global competitors.
Next Steps
In conclusion, Gruma SAB de CV's upcoming dividend, consistent dividend growth rate, modest payout ratio, and strong profitability and growth metrics paint a promising picture for investors seeking value and reliability in their investments. The company's ability to sustain and potentially increase its dividend payments is supported by a solid financial foundation and a positive growth outlook. As Gruma SAB de CV continues to navigate the dynamic food production industry, investors may find reassurance in the company's commitment to delivering shareholder value through dividends. Will Gruma SAB de CV's strategic initiatives and market position enable it to continue this trend of rewarding investors? Only time will tell, but the indicators suggest a positive trajectory for this seasoned player in the food sector.
GuruFocus Premium users can screen for high-dividend yield stocks using the High Dividend Yield Screener.
This article, generated by GuruFocus, is designed to provide general insights and is not tailored financial advice. Our commentary is rooted in historical data and analyst projections, utilizing an impartial methodology, and is not intended to serve as specific investment guidance. It does not formulate a recommendation to purchase or divest any stock and does not consider individual investment objectives or financial circumstances. Our objective is to deliver long-term, fundamental data-driven analysis. Be aware that our analysis might not incorporate the most recent, price-sensitive company announcements or qualitative information. GuruFocus holds no position in the stocks mentioned herein.
This article first appeared on GuruFocus.
