
 Yahoo Finance
 Should Grifols (BME:GRF) Be Disappointed With Their 61% Profit?

When we invest, we're generally looking for stocks that outperform the market average. And while active stock picking involves risks (and requires diversification) it can also provide excess returns. For example, the Grifols, S.A. (BME:GRF) share price is up 61% in the last 5 years, clearly besting than the market return of around -19% (ignoring dividends). However, more recent returns haven't been as impressive as that, with the stock returning just 15% in the last year, including dividends.
See our latest analysis for Grifols
While markets are a powerful pricing mechanism, share prices reflect investor sentiment, not just underlying business performance. By comparing earnings per share (EPS) and share price changes over time, we can get a feel for how investor attitudes to a company have morphed over time.
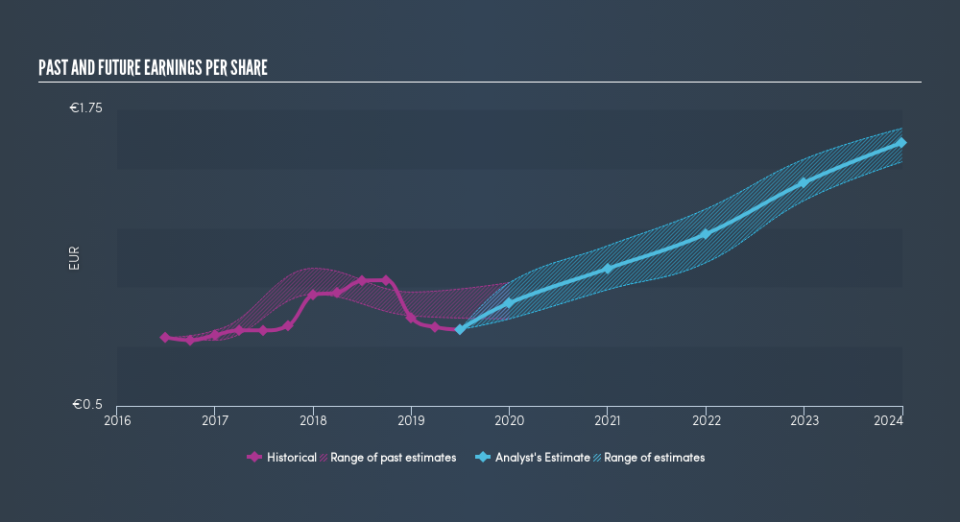
Over half a decade, Grifols managed to grow its earnings per share at 7.9% a year. This EPS growth is slower than the share price growth of 10% per year, over the same period. This suggests that market participants hold the company in higher regard, these days. That's not necessarily surprising considering the five-year track record of earnings growth.
The image below shows how EPS has tracked over time (if you click on the image you can see greater detail).
We consider it positive that insiders have made significant purchases in the last year. Having said that, most people consider earnings and revenue growth trends to be a more meaningful guide to the business. This free interactive report on Grifols's earnings, revenue and cash flow is a great place to start, if you want to investigate the stock further.
What About Dividends?
It is important to consider the total shareholder return, as well as the share price return, for any given stock. Whereas the share price return only reflects the change in the share price, the TSR includes the value of dividends (assuming they were reinvested) and the benefit of any discounted capital raising or spin-off. It's fair to say that the TSR gives a more complete picture for stocks that pay a dividend. As it happens, Grifols's TSR for the last 5 years was 71%, which exceeds the share price return mentioned earlier. The dividends paid by the company have thusly boosted the total shareholder return.
A Different Perspective
It's nice to see that Grifols shareholders have received a total shareholder return of 15% over the last year. That's including the dividend. Since the one-year TSR is better than the five-year TSR (the latter coming in at 11% per year), it would seem that the stock's performance has improved in recent times. Someone with an optimistic perspective could view the recent improvement in TSR as indicating that the business itself is getting better with time. It is all well and good that insiders have been buying shares, but we suggest you check here to see what price insiders were buying at.
If you like to buy stocks alongside management, then you might just love this free list of companies. (Hint: insiders have been buying them).
Please note, the market returns quoted in this article reflect the market weighted average returns of stocks that currently trade on ES exchanges.
We aim to bring you long-term focused research analysis driven by fundamental data. Note that our analysis may not factor in the latest price-sensitive company announcements or qualitative material.
If you spot an error that warrants correction, please contact the editor at editorial-team@simplywallst.com. This article by Simply Wall St is general in nature. It does not constitute a recommendation to buy or sell any stock, and does not take account of your objectives, or your financial situation. Simply Wall St has no position in the stocks mentioned. Thank you for reading.
