
 Yahoo Finance
 Greiffenberger's (FRA:GRF) Returns On Capital Not Reflecting Well On The Business
There are a few key trends to look for if we want to identify the next multi-bagger. Firstly, we'd want to identify a growing return on capital employed (ROCE) and then alongside that, an ever-increasing base of capital employed. If you see this, it typically means it's a company with a great business model and plenty of profitable reinvestment opportunities. However, after briefly looking over the numbers, we don't think Greiffenberger (FRA:GRF) has the makings of a multi-bagger going forward, but let's have a look at why that may be.
Understanding Return On Capital Employed (ROCE)
If you haven't worked with ROCE before, it measures the 'return' (pre-tax profit) a company generates from capital employed in its business. The formula for this calculation on Greiffenberger is:
Return on Capital Employed = Earnings Before Interest and Tax (EBIT) ÷ (Total Assets - Current Liabilities)
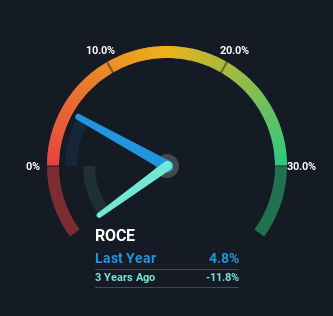
0.048 = €2.2m ÷ (€62m - €16m) (Based on the trailing twelve months to June 2023).
Therefore, Greiffenberger has an ROCE of 4.8%. Ultimately, that's a low return and it under-performs the Machinery industry average of 11%.
View our latest analysis for Greiffenberger
While the past is not representative of the future, it can be helpful to know how a company has performed historically, which is why we have this chart above. If you'd like to look at how Greiffenberger has performed in the past in other metrics, you can view this free graph of Greiffenberger's past earnings, revenue and cash flow.
What Can We Tell From Greiffenberger's ROCE Trend?
On the surface, the trend of ROCE at Greiffenberger doesn't inspire confidence. Around five years ago the returns on capital were 6.9%, but since then they've fallen to 4.8%. However it looks like Greiffenberger might be reinvesting for long term growth because while capital employed has increased, the company's sales haven't changed much in the last 12 months. It's worth keeping an eye on the company's earnings from here on to see if these investments do end up contributing to the bottom line.
What We Can Learn From Greiffenberger's ROCE
Bringing it all together, while we're somewhat encouraged by Greiffenberger's reinvestment in its own business, we're aware that returns are shrinking. Since the stock has gained an impressive 93% over the last five years, investors must think there's better things to come. Ultimately, if the underlying trends persist, we wouldn't hold our breath on it being a multi-bagger going forward.
One final note, you should learn about the 3 warning signs we've spotted with Greiffenberger (including 1 which makes us a bit uncomfortable) .
While Greiffenberger isn't earning the highest return, check out this free list of companies that are earning high returns on equity with solid balance sheets.
Have feedback on this article? Concerned about the content? Get in touch with us directly. Alternatively, email editorial-team (at) simplywallst.com.
This article by Simply Wall St is general in nature. We provide commentary based on historical data and analyst forecasts only using an unbiased methodology and our articles are not intended to be financial advice. It does not constitute a recommendation to buy or sell any stock, and does not take account of your objectives, or your financial situation. We aim to bring you long-term focused analysis driven by fundamental data. Note that our analysis may not factor in the latest price-sensitive company announcements or qualitative material. Simply Wall St has no position in any stocks mentioned.
