
 Yahoo Finance
 Are Greencore Group plc's (LON:GNC) Mixed Financials The Reason For Its Gloomy Performance on The Stock Market?
Greencore Group (LON:GNC) has had a rough three months with its share price down 24%. It seems that the market might have completely ignored the positive aspects of the company's fundamentals and decided to weigh-in more on the negative aspects. Stock prices are usually driven by a company’s financial performance over the long term, and therefore we decided to pay more attention to the company's financial performance. Specifically, we decided to study Greencore Group's ROE in this article.
Return on equity or ROE is a key measure used to assess how efficiently a company's management is utilizing the company's capital. Simply put, it is used to assess the profitability of a company in relation to its equity capital.
Check out our latest analysis for Greencore Group
How Is ROE Calculated?
Return on equity can be calculated by using the formula:
Return on Equity = Net Profit (from continuing operations) ÷ Shareholders' Equity
So, based on the above formula, the ROE for Greencore Group is:
5.9% = UK£26m ÷ UK£441m (Based on the trailing twelve months to March 2022).
The 'return' refers to a company's earnings over the last year. So, this means that for every £1 of its shareholder's investments, the company generates a profit of £0.06.
What Is The Relationship Between ROE And Earnings Growth?
So far, we've learned that ROE is a measure of a company's profitability. Depending on how much of these profits the company reinvests or "retains", and how effectively it does so, we are then able to assess a company’s earnings growth potential. Assuming all else is equal, companies that have both a higher return on equity and higher profit retention are usually the ones that have a higher growth rate when compared to companies that don't have the same features.
Greencore Group's Earnings Growth And 5.9% ROE
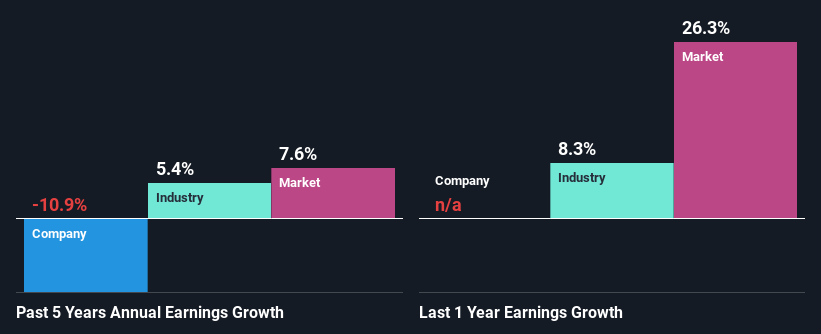
On the face of it, Greencore Group's ROE is not much to talk about. A quick further study shows that the company's ROE doesn't compare favorably to the industry average of 10% either. Given the circumstances, the significant decline in net income by 11% seen by Greencore Group over the last five years is not surprising. We believe that there also might be other aspects that are negatively influencing the company's earnings prospects. For example, it is possible that the business has allocated capital poorly or that the company has a very high payout ratio.
However, when we compared Greencore Group's growth with the industry we found that while the company's earnings have been shrinking, the industry has seen an earnings growth of 5.4% in the same period. This is quite worrisome.
Earnings growth is a huge factor in stock valuation. The investor should try to establish if the expected growth or decline in earnings, whichever the case may be, is priced in. This then helps them determine if the stock is placed for a bright or bleak future. Is GNC fairly valued? This infographic on the company's intrinsic value has everything you need to know.
Is Greencore Group Using Its Retained Earnings Effectively?
While the company did payout a portion of its dividend in the past, it currently doesn't pay a dividend. This implies that potentially all of its profits are being reinvested in the business.
Summary
On the whole, we feel that the performance shown by Greencore Group can be open to many interpretations. While the company does have a high rate of profit retention, its low rate of return is probably hampering its earnings growth. So far, we've only made a quick discussion around the company's earnings growth. To gain further insights into Greencore Group's past profit growth, check out this visualization of past earnings, revenue and cash flows.
Have feedback on this article? Concerned about the content? Get in touch with us directly. Alternatively, email editorial-team (at) simplywallst.com.
This article by Simply Wall St is general in nature. We provide commentary based on historical data and analyst forecasts only using an unbiased methodology and our articles are not intended to be financial advice. It does not constitute a recommendation to buy or sell any stock, and does not take account of your objectives, or your financial situation. We aim to bring you long-term focused analysis driven by fundamental data. Note that our analysis may not factor in the latest price-sensitive company announcements or qualitative material. Simply Wall St has no position in any stocks mentioned.
Join A Paid User Research Session
You’ll receive a US$30 Amazon Gift card for 1 hour of your time while helping us build better investing tools for the individual investors like yourself. Sign up here
