
 Yahoo Finance
 How Good Is James Hardie Industries plc (ASX:JHX) At Creating Shareholder Value?

Today we are going to look at James Hardie Industries plc (ASX:JHX) to see whether it might be an attractive investment prospect. Specifically, we'll consider its Return On Capital Employed (ROCE), since that will give us an insight into how efficiently the business can generate profits from the capital it requires.
First of all, we'll work out how to calculate ROCE. Next, we'll compare it to others in its industry. Then we'll determine how its current liabilities are affecting its ROCE.
Understanding Return On Capital Employed (ROCE)
ROCE is a metric for evaluating how much pre-tax income (in percentage terms) a company earns on the capital invested in its business. All else being equal, a better business will have a higher ROCE. In brief, it is a useful tool, but it is not without drawbacks. Author Edwin Whiting says to be careful when comparing the ROCE of different businesses, since 'No two businesses are exactly alike.
So, How Do We Calculate ROCE?
The formula for calculating the return on capital employed is:
Return on Capital Employed = Earnings Before Interest and Tax (EBIT) ÷ (Total Assets - Current Liabilities)
Or for James Hardie Industries:
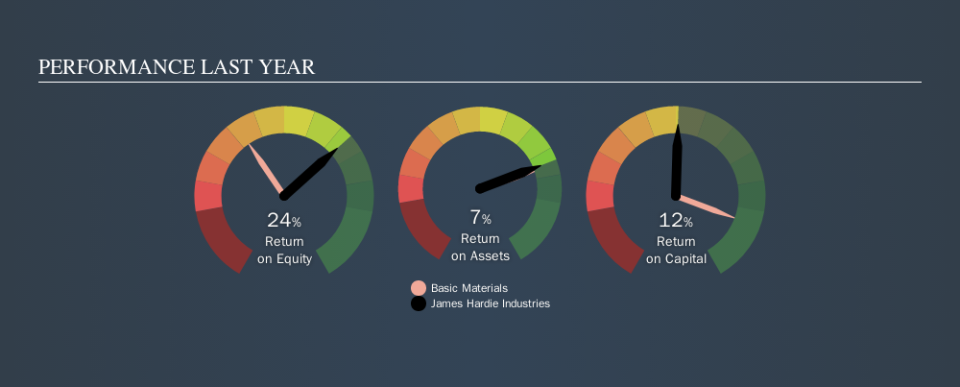
0.12 = US$425m ÷ (US$4.1b - US$632m) (Based on the trailing twelve months to June 2019.)
Therefore, James Hardie Industries has an ROCE of 12%.
View our latest analysis for James Hardie Industries
Does James Hardie Industries Have A Good ROCE?
ROCE is commonly used for comparing the performance of similar businesses. It appears that James Hardie Industries's ROCE is fairly close to the Basic Materials industry average of 10%. Independently of how James Hardie Industries compares to its industry, its ROCE in absolute terms appears decent, and the company may be worthy of closer investigation.
We can see that, James Hardie Industries currently has an ROCE of 12%, less than the 25% it reported 3 years ago. This makes us wonder if the business is facing new challenges. You can click on the image below to see (in greater detail) how James Hardie Industries's past growth compares to other companies.
It is important to remember that ROCE shows past performance, and is not necessarily predictive. ROCE can be deceptive for cyclical businesses, as returns can look incredible in boom times, and terribly low in downturns. ROCE is only a point-in-time measure. Future performance is what matters, and you can see analyst predictions in our free report on analyst forecasts for the company.
How James Hardie Industries's Current Liabilities Impact Its ROCE
Current liabilities include invoices, such as supplier payments, short-term debt, or a tax bill, that need to be paid within 12 months. The ROCE equation subtracts current liabilities from capital employed, so a company with a lot of current liabilities appears to have less capital employed, and a higher ROCE than otherwise. To counter this, investors can check if a company has high current liabilities relative to total assets.
James Hardie Industries has total assets of US$4.1b and current liabilities of US$632m. Therefore its current liabilities are equivalent to approximately 15% of its total assets. Low current liabilities are not boosting the ROCE too much.
What We Can Learn From James Hardie Industries's ROCE
Overall, James Hardie Industries has a decent ROCE and could be worthy of further research. James Hardie Industries shapes up well under this analysis, but it is far from the only business delivering excellent numbers . You might also want to check this free collection of companies delivering excellent earnings growth.
If you like to buy stocks alongside management, then you might just love this free list of companies. (Hint: insiders have been buying them).
We aim to bring you long-term focused research analysis driven by fundamental data. Note that our analysis may not factor in the latest price-sensitive company announcements or qualitative material.
If you spot an error that warrants correction, please contact the editor at editorial-team@simplywallst.com. This article by Simply Wall St is general in nature. It does not constitute a recommendation to buy or sell any stock, and does not take account of your objectives, or your financial situation. Simply Wall St has no position in the stocks mentioned. Thank you for reading.
