
 Yahoo Finance
 Gold Probes 7-Week Low, SPX 500 Continues to Carve Out Double Top
DailyFX.com -
Talking Points:
US Dollar Corrects Higher But 3-Week Down Trend Still Intact
S&P 500 Continues to Carve Out Double Top Below 2200 Mark
Crude Oil Digesting Gains, Gold Prices Probe Seven-Week Low
Can’t access the Dow Jones FXCM US Dollar Index? Try the USD basket on Mirror Trader. **
US DOLLAR TECHNICAL ANALYSIS – Prices corrected upward as expected after putting in a bullish Piercing Line candle pattern. Near-term channel resistance is at 11866, with a break above that on a daily closing basis exposing the 38.2% Fibonacci retracement at 11901. Alternatively, a reversal below the 23.6% level at 11839 clears the way for a test of the 14.6% Fib at 11801.
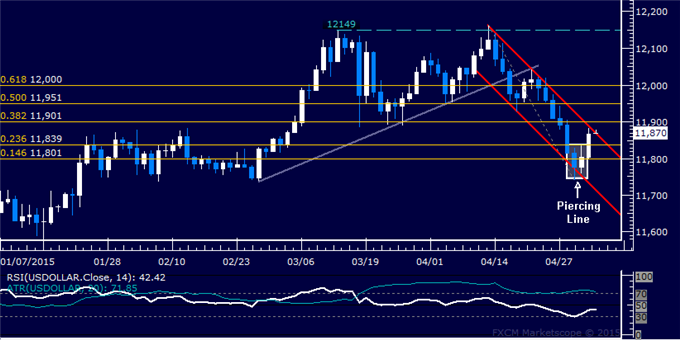
Daily Chart - Created Using FXCM Marketscope
** The Dow Jones FXCM US Dollar Index and the Mirror Trader USD basket are not the same product.
S&P 500 TECHNICAL ANALYSIS – Prices declined as expected after putting in a Bearish Engulfing candlestick pattern, hinting a double top is forming at 2119.40 (February 25 high). A break below the 14.6% Fibonacci retracement at 2081.10 exposes the 23.6% level at 2053.40. Alternatively, a move above trend line resistance at 2107.70 targets 2119.40 anew.
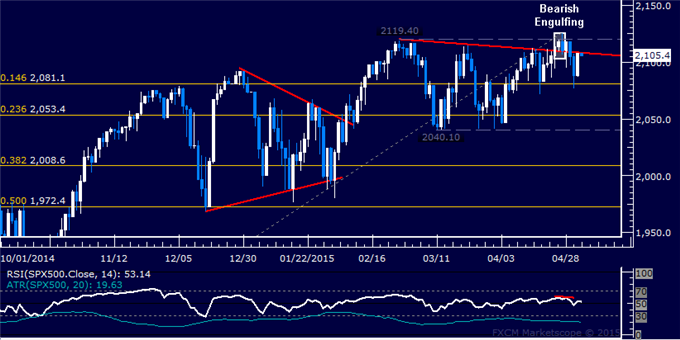
Daily Chart - Created Using FXCM Marketscope
GOLD TECHNICAL ANALYSIS – Prices are testing support at 1177.53, the 76.4% Fibonacci expansion, with a break below that exposing the 100% level at 1165.95. Alternatively, a break above the 61.8% Fib at 1184.69 targets the 50% expansion at 1190.47.
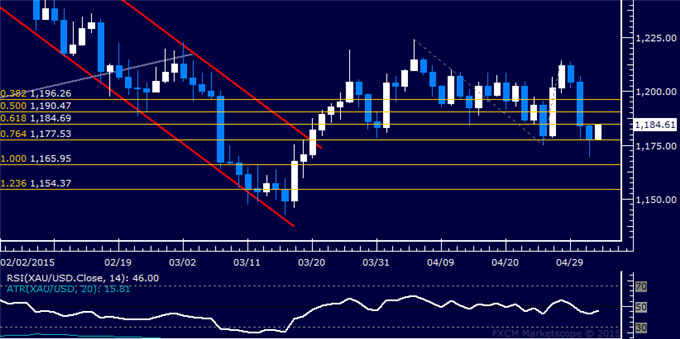
Daily Chart - Created Using FXCM Marketscope
CRUDE OIL TECHNICAL ANALYSIS – Prices are digesting gains after rising to the highest level in five months. A break above the 50% Fibonacci expansion at 67.55 exposes the 61.8% level at 69.01. Alternatively, a move below the 38.2% Fib at 66.09 targets the 23.6% expansion at 64.29.
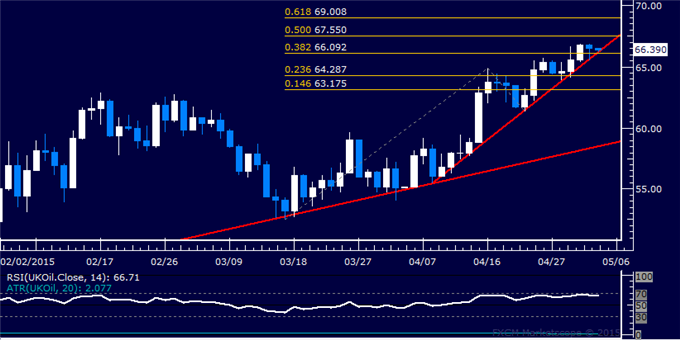
Daily Chart - Created Using FXCM Marketscope
--- Written by Ilya Spivak, Currency Strategist for DailyFX.com
To receive Ilya's analysis directly via email, please SIGN UP HERE
Contact and follow Ilya on Twitter: @IlyaSpivak
DailyFX provides forex news and technical analysis on the trends that influence the global currency markets.
Learn forex trading with a free practice account and trading charts from FXCM.
