
 Yahoo Finance
 Gold Prices and US Dollar Pause Ahead of FOMC
DailyFX.com -
Talking Points:
Gold Prices and the US Dollar Take a Pause Ahead of FOMC
US Dollar Bullish Breakouts Begin Above 101.54
Bearish Breakouts for Gold Prices are Identified Beneath $1,157.30
Gold prices and the US Dollar (Ticker:Ticker::DXY) continue to consolidate, as the market fundamentally begins to focus on next week’s FOMC rate decision. The event is critical because rates are expected to rise for the first time since December 2015. Even though a hike would only bring expected rates to 0.50%, this move in policy could drastically affect commodities such as gold that are prices in Dollars.
US Dollar Daily Chart and Inside Bar

(Created Using TradingView Charts)
What’s next for the US Dollar? Read Our Dollar Market Forecast HERE
Technically, the US Dollar Index (Symbol DXY) is set to conclude today’s trading with the creation of an inside bar. Prices have yet to trade above yesterday’s high of 101.54 or below yesterday’s low of 99.85 to complete this pattern. While this pattern is considered a consolidating pattern, traders may use these points to plan the US Dollars next major breakout. A move above resistance at 101.54 should be considered significant as it would put the US Dollar back on track to resume its primary daily uptrend. However a breakout below support may signal a larger bearish retracement for the Index.
Gold Price Daily Chart and Inside Bar
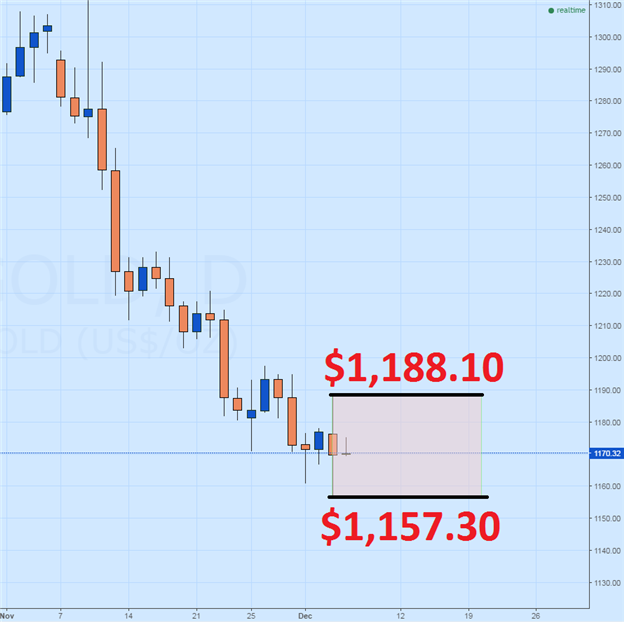
(Created Using TradingView Charts)
Looking for additional trade ideas for Gold and commodities markets? Read Our Gold Market Forecast
Gold prices are trading in a similar pattern, by also failing to establish a new daily high or low. Gold prices traded to a new daily low yesterday, which creates a barrier of support at. Alternatively the daily high for Monday’s trading may be used as a point of resistance at $1,188.10. A bearish breakout in Gold prices may be synonymous with a bullish breakout in the US Dollar. A move of this nature may set the commodity up to retest 2016 lows at $1,061.25. In the event of a bullish breakout, Gold prices may begin to retrace more of the bearish decline which has been developing since the July 2016 high was put in place at $1,375.12.
--- Written by Walker, Analyst for DailyFX.com
To Receive Walkers’ analysis directly via email, please SIGN UP HERE
See Walker’s most recent articles at hisBio Page.
Contact and Follow Walker on Twitter @WEnglandFX.
DailyFX provides forex news and technical analysis on the trends that influence the global currency markets.
Learn forex trading with a free practice account and trading charts from IG.
