Gold Prices Stall After 7 Day Rally
DailyFX.com -
Talking Points:
Gold Prices Stall After 7 Day Rally
Technically Gold Consolidates With an Inside Bar
Sentiment Figures Remain Mixed, Reading at +1.40
Gold prices have risen for seven consecutive sessions, but are now retreating in today’s trading as the US Dollar firms in the short term. This move has been predicated on US CPI data falling in line with expectations this morning at 2.1%. Now as gold prices consolidate, traders may continue to watch key technical levels to determine the direction of the commodities next breakout.
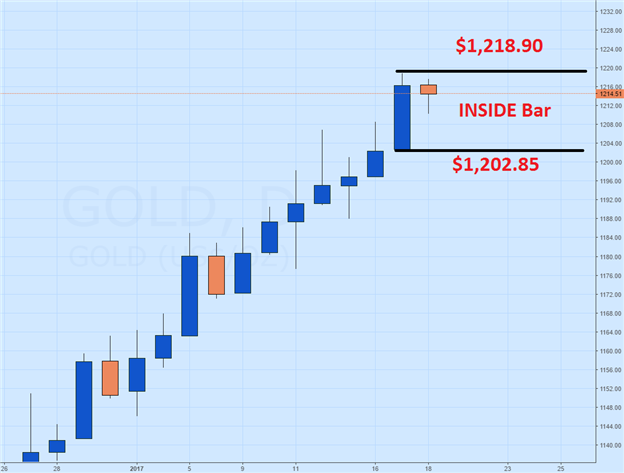
Technically traders should note that gold prices are forming an inside bar, with prices failing to breakout to a new high or low for today’s session. This means traders may use Tuesday’s daily bar as a reference for values of support and resistance. Bullish daily breakouts may be planned above Tuesday’s high at $1,218.90, while bearish breakouts may be signaled beneath the low at $1,202.85.
Gold Price Daily Chart & Inside Bar
(Created Using TradingView Charts)
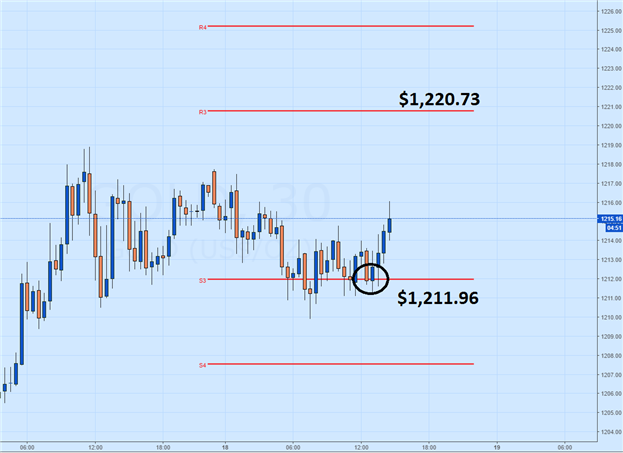
Intraday, gold prices continue to range after testing support at today’s S3 pivot at a price of $1,211.96. If prices fail to breach this value of support, gold may continue to bounce towards key points of resistance. Today’s R3 pivot is displayed below at $1,220.73. A move to this value should be seen as significant as it would invalidate the previously mentioned inside bar pattern on the daily graph.
In the event that gold prices do fall further, bearish breakouts for the metal may be identified intraday beneath the S4 pivot at $1,207.53. An intraday bearish breakout should be seen as significant, as it would be just the first attempted bearish breakout in the last five trading days.
Gold Price 30 Minute Chart & Pivot range
(Created Using TradingView Charts)
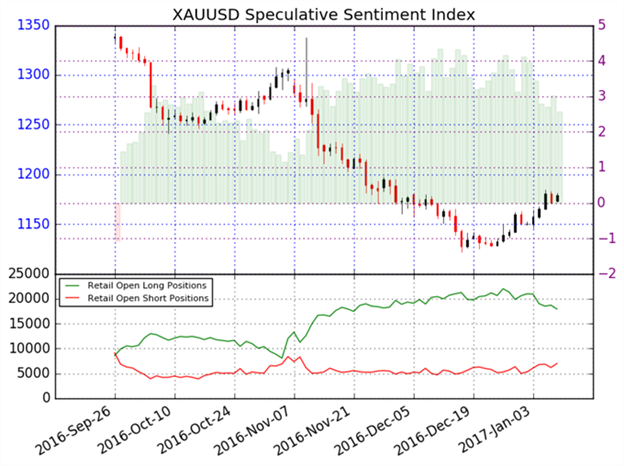
Lastly, sentiment values for Gold remain modestly long, with SSI reading at +1.40. This total shows that 59% of positioning long, and 41% short. If gold remains in a consolidation phase, these values may continue to remain neutral with both long and short positions being relatively equal. If gold prices breakout higher, we should begin to see SSI values turn towards a negative extreme. Alternatively if gold prices breakout lower, it would be reasonably expected to see SSI totals reach a new positive extreme.
--- Written by Walker, Analyst for DailyFX.com
To Receive Walkers’ analysis directly via email, please SIGN UP HERE
See Walker’s most recent articles at his Bio Page.
Contact and Follow Walker on Twitter @WEnglandFX.
DailyFX provides forex news and technical analysis on the trends that influence the global currency markets.
Learn forex trading with a free practice account and trading charts from IG.

 Yahoo Finance


