
 Yahoo Finance
 Gold Price Futures (GC) Technical Analysis – Longer-Term Support Zone at $1780.50 – $1705.20 Next Target Area
Gold futures are down sharply on Friday and the market is headed for its second consecutive weekly loss as a surge in the U.S. Dollar dampened demand for the dollar-denominated asset. The dollar was on track to post its biggest weekly gain against a basket of major currencies since October 2020.
At 21:32 GMT, February Comex gold futures are trading $1825.70, down $25.70 or -1.39%.
Traders said one catalyst behind the strength in the U.S. Dollar was data showing the COVID-19 pandemic’s continuing toll on the economy, which boosted the dollar’s appeal as a safe-haven asset.
Daily Swing Chart Technical Analysis
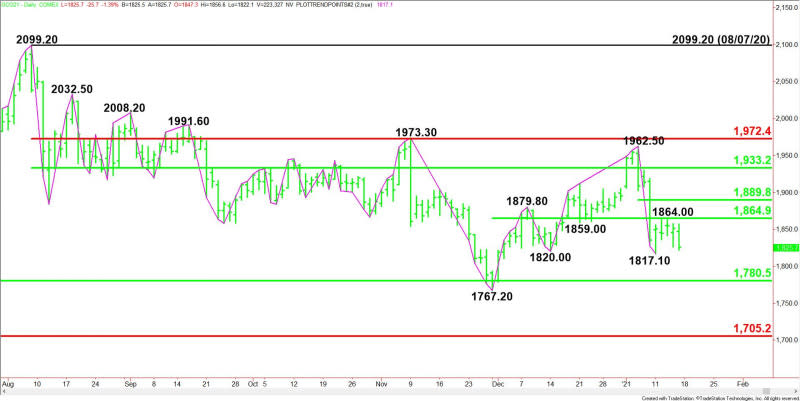
The main trend is down according to the daily swing chart. A trade through $1817.10 will signal a resumption of the downtrend. The main trend will change to up on a move through $1962.50.
The minor trend is also down. The minor trend will change to up on a move through $1864.00. This will also shift momentum to the upside.
The short-term range is $1767.20 to $1962.50. Its 50% level at $1864.90 is resistance.
The minor range is $1962.50 to $1817.10. Its 50% level at $1889.80 is another potential resistance level.
The next downside target is a major long-term retracement zone at $1780.50 to $1705.20.
Short-Term Outlook
Given the downtrend and the downside momentum, we think the gold market is headed for a retest of the long-term 50% to 61.8% retracement zone at $1780.50 to $1705.20. This zone stopped the selling at $1767.20 on November 30.
On the upside, the series of lower tops since last year’s top at $2099.20 is pretty clear. They come in at $2032.50, $2008.50, $1991.60, $1973.30 and $1962.50. Unless the buying is strong enough to overcome these levels, we should continue to see downside pressure.
Long-term traders are looking for value so we could see buyers step in on a test of $1780.50 to $1705.20. They are banking of the Fed to keep interest rates at historically low levels until at least 2023.
Short-term traders are getting punished, however, by rising U.S. Treasury yields. Over the short-run, gold should remain under pressure as long as yields remain attractive enough to draw investment capital away from non-yielding gold.
For a look at all of today’s economic events, check out our economic calendar.
This article was originally posted on FX Empire
