
 Yahoo Finance
 Gold Price Futures (GC) Technical Analysis – Close Under $1867.60 Could Trigger Start of 2 – 3 Day Correction
Gold futures are trading nearly flat late in the session on Tuesday after giving back earlier gains as U.S. Treasury yields inched higher. Nonetheless, the market remained near a four-month peak as a weaker U.S. Dollar and inflation fears continued to underpin prices.
At 17:42 GMT, June Comex gold futures are trading $1868.70, up $1.10 or +0.06%.
Daily Swing Chart Technical Analysis
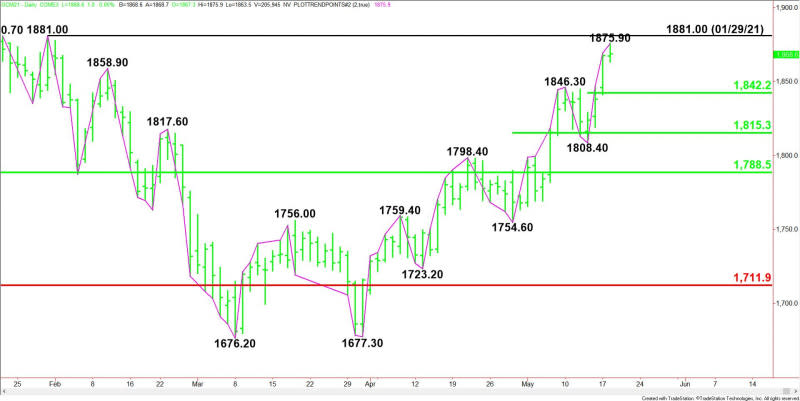
The main trend is up according to the daily swing chart. A trade through the intraday high of $1875.90 will signal a resumption of the uptrend. A move through the January 29 main top will reaffirm the uptrend. Taking out $1808.40 will change the main trend to down.
The new minor range is $1808.40 to $1875.90. Its 50% level at $1842.20 is the first downside target.
The short-term range is $1754.60 to $1875.90. Its 50% level at $1815.30 is the last potential support before the $1808.40 main bottom.
Daily Swing Chart Technical Forecast
The direction of the June Comex gold market into the close is likely to be determined by trader reaction to $1867.60.
Bullish Scenario
A sustained move over $1867.60 will indicate the presence of buyers. Taking out the intraday high at $1875.90 will indicate the buying is getting stronger. This could lead to a quick test of the January 29 main top at $1881.00. This is a potential trigger point for an acceleration to the upside.
Bearish Scenario
A sustained move under $1867.60 will signal the presence of sellers. If this move creates enough downside momentum late in the session then look for a possible break into the first minor pivot at $1842.20.
Side Notes
A close under $1867.60 will form a potentially bearish closing price reversal top. If confirmed, this could trigger the start of a 2 to 3 day correction with $1842.20 the first target.
For a look at all of today’s economic events, check out our economic calendar.
This article was originally posted on FX Empire
