
 Yahoo Finance
 Gold Price Futures (GC) Technical Analysis – Weekly Trend Turned Up Last Week
Gold futures are trading steady early Monday underpinned by a weaker U.S. Dollar. The greenback is being pressured by Friday’s disappointing U.S. jobs data that fueled speculation that the Fed would curtail the number of rate hikes in 2019 after it raises rates for the fourth time next week. Traders are also watching Treasury yields, which plunged last week, making the U.S. Dollar a less-attractive investment.
At 0554 GMT, February Comex Gold is trading $1255.00, up $2.40 or +0.19%.
Weekly Swing Chart Technical Analysis
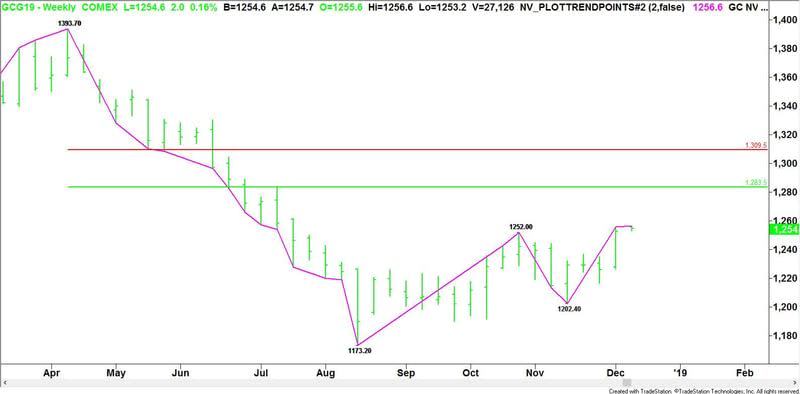
The main trend is up according to the weekly swing chart. The trend turned up last week when buyers took out the previous main top at $1252.00. A trade through $1202.40 will change the main trend to down.
The main range is $1393.70 to $1173.20. Its retracement zone at $1283.50 to $1309.50 is the primary upside target.
Weekly Swing Chart Technical Forecast
Based on last week’s close at $1252.60 and the earlier price action, the direction of the February Comex gold futures contract is likely to be determined by trader reaction to the previous main top at $1252.00.
Bullish Scenario
A sustained move over $1252.00 will indicate the presence of buyers. If they can sustain the upside momentum then look for an eventual test of the 50% level at $1283.50. A sustained move over $1252.00 will also indicate the buying is real with new longs entering the market.
Bearish Scenario
A sustained move under $1252.00 will signal the presence of sellers. This will indicate the selling is greater than the buying at current price levels. It will also indicate that the breakout over $1252.00 was likely fueled by buy stops rather than aggressive buyers. This could lead to a retracement of the rally from $1202.40.
This article was originally posted on FX Empire
More From FXEMPIRE:
Gold Price Futures (GC) Technical Analysis – Weekly Trend Turned Up Last Week
Stellar’s Lumen Technical Analysis – Support Levels Eyed – 10/12/18
DAX Index Daily Price Forecast – DAX To Trade Dovish On Cues From Asian Counterpart
It’s a Back Foot Dollar as Sentiment towards FED Policy Shifts
Oil Price Fundamental Daily Forecast – Production Cuts Generating Surge in Brent Futures
Precious Metals Steady Near Recent High’s On Weak USD In Broad Market
