
 Yahoo Finance
 Gold Price Futures (GC) Technical Analysis – Weakens Under $1770.40, Strengthens Over $1779.60
Gold futures are trading lower early Thursday, pressured by firm U.S. Treasury yields and a stronger U.S. Dollar. Meanwhile, investors continue to digest another day of mixed signals from Federal Reserve officials on rate hikes from Wednesday while awaiting a slew of U.S. economic data later in the day.
At 04:32 GMT, August Comex Gold futures are trading $1773.80, down $9.60 or -0.54%.
Gold prices retreated from their high on Wednesday after two Fed officials said that a period of high inflation in the United States may last longer than anticipated, a day after Fed Chair Jerome Powell downplayed inflation worries and signaled interest rates would not be hiked too quickly.
Later on Thursday, investors will get the opportunity to react to the U.S. Final GDP report and weekly unemployment claims. The first one is stale data, but weekly initial claims will offer up data on the strength of the labor market. Other reports include durable goods and the Goods Trade Balance.
Daily Swing Chart Technical Analysis
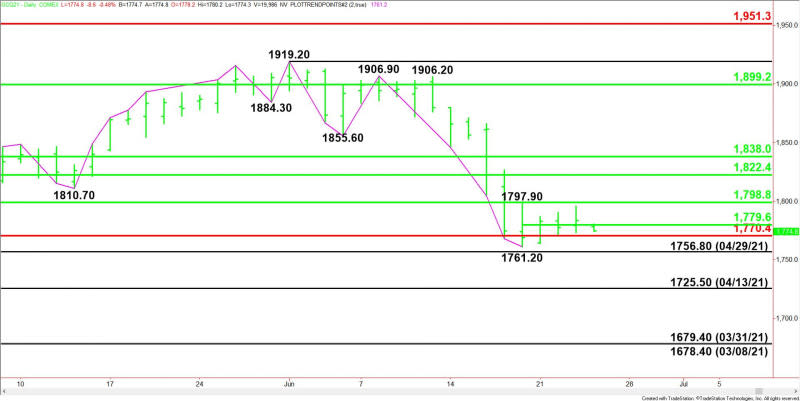
The main trend is down according to the daily swing chart. A trade through $1761.20 will signal a resumption of the downtrend. The main trend will change to up on a move through $1906.90.
The market is also trading inside last Friday’s range at $1761.20 to $1797.90. This chart pattern tends to indicate investor indecision and impending volatility.
The main range is $1678.40 to $1919.20. The market is currently testing the lower level of its retracement zone at $1798.80 to $1770.40. This zone is controlling the near-term direction of the market.
The minor range is $1761.20 to $1797.90. Gold is currently trading on the weak side of its pivot at $1779.60.
On the upside, the nearest resistance is a series of 50% levels at $1798.80, $1822.40 and $1838.30. The latter is a potential trigger point for an acceleration to the upside.
Daily Swing Chart Technical Forecast
The direction of the August Comex gold market on Thursday is likely to be determined by trader reaction to the minor pivot at $1779.60.
Bearish Scenario
A sustained move under $1779.60 will indicate the presence of sellers. Taking out $1770.40 will indicate the selling is getting stronger with $1761.20 and $1756.80 the next likely downside targets.
If $1756.80 fails then look for the start of a sharp break with $1725.50 the next potential target.
Bullish Scenario
A sustained move over $1779.60 will signal the presence of buyers. The first potential upside targets are $1797.90 and $1798.80. Taking out $1798.80 could trigger an acceleration into a pair of 50% levels at $1822.40 and $1838.00.
For a look at all of today’s economic events, check out our economic calendar.
This article was originally posted on FX Empire
