Advertisement
Australia markets closed
  • ALL ORDS

    7,837.40
    -100.10 (-1.26%)
     
  • ASX 200

    7,575.90
    -107.10 (-1.39%)
     
  • AUD/USD

    0.6537
    +0.0014 (+0.22%)
     
  • OIL

    83.75
    +0.18 (+0.22%)
     
  • GOLD

    2,351.20
    +8.70 (+0.37%)
     
  • Bitcoin AUD

    97,833.70
    -991.17 (-1.00%)
     
  • CMC Crypto 200

    1,333.77
    -62.77 (-4.49%)
     
  • AUD/EUR

    0.6107
    +0.0033 (+0.55%)
     
  • AUD/NZD

    1.0993
    +0.0036 (+0.32%)
     
  • NZX 50

    11,805.09
    -141.34 (-1.18%)
     
  • NASDAQ

    17,739.89
    +309.39 (+1.77%)
     
  • FTSE

    8,139.83
    +60.97 (+0.75%)
     
  • Dow Jones

    38,281.43
    +195.63 (+0.51%)
     
  • DAX

    18,161.01
    +243.73 (+1.36%)
     
  • Hang Seng

    17,651.15
    +366.61 (+2.12%)
     
  • NIKKEI 225

    37,934.76
    +306.28 (+0.81%)
     

Gold Price at 5 Year Trendline for 3rd Consecutive Month

DailyFX.com -

Daily

Gold Price at 5 Year Trendline for 3rd Consecutive Month

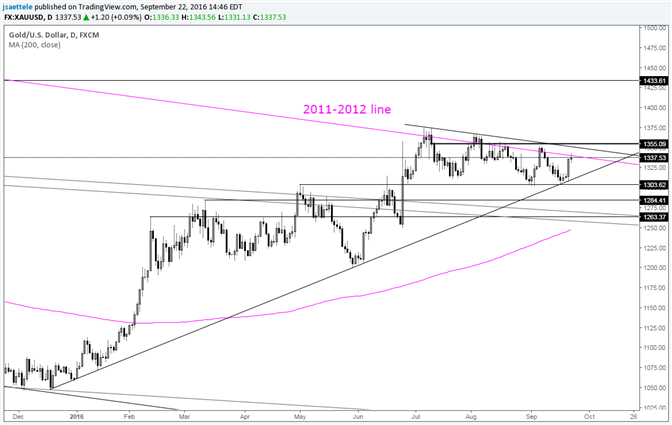
Chart Prepared by Jamie Saettele, CMT

DailyFX Trading Guides and Forecasts

-Gold has been in a state of indecision since July. Each rally has failed at the trendline and each high has been lower than the prior high. This may need to resolve with a drop towards the low 1960s before broader strength can resume. If price closes above 1355, then action since July can be interpreted as a bullish wedge. Until that close is registered, risk remains for weakness towards the low 1260s.

For more analysis and trade setups (exact entry and exit), visit SB Trade Desk


original source

DailyFX provides forex news and technical analysis on the trends that influence the global currency markets.
Learn forex trading with a free practice account and trading charts from FXCM.