
 Yahoo Finance
 Gold Holds at Familiar Support, SPX 500 Revisits Range Top
DailyFX.com -
Talking Points:
US Dollar Positioning Hints Prices May Return to the Offensive
S&P 500 Struggling to Make Good on Bearish Reversal Setup
Crude Oil Consolidating, Gold Bounces from Familiar Support
Can’t access the Dow Jones FXCM US Dollar Index? Try the USD basket on Mirror Trader. **
US DOLLAR TECHNICAL ANALYSIS – Prices turned higher as expected after producing a bullish Piercing Line candle pattern. A daily close above the 38.2% Fibonacci retracement at 11901 exposes the 50% level at 11951. Alternatively, a reversal below the 23.6% level at 11839 opens the door for a challenge of the 14.6% Fib at 11801.

Daily Chart - Created Using FXCM Marketscope
** The Dow Jones FXCM US Dollar Index and the Mirror Trader USD basket are not the same product.
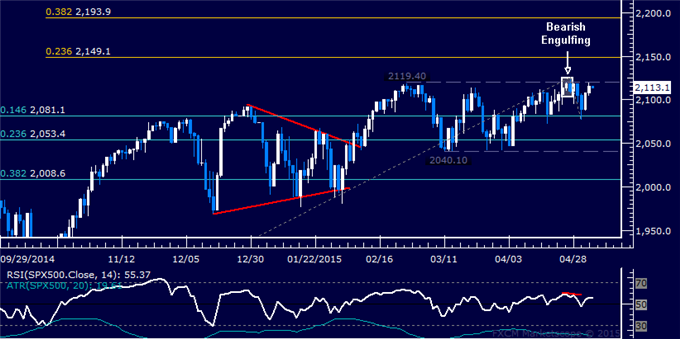
S&P 500 TECHNICAL ANALYSIS – Prices are struggling to maintain downward momentum after putting in a Bearish Engulfing candlestick pattern but the setup remains technically valid for now, warning that a double top may yet be confirmed at 2119.40 (February 25 high). A break below the 14.6% Fibonacci retracement at 2081.10 exposes the 23.6% level at 2053.40. Alternatively, a move back above 2119.40 targets the 23.6% Fib expansion at 2149.10.
Daily Chart - Created Using FXCM Marketscope
GOLD TECHNICAL ANALYSIS – Prices found support at a familiar range floor above $1175/oz once again. From here a push above the 50% Fibonacci expansion at 1190.47 exposes the 38.2% level at 1196.26. Alternatively, a move below the 61.8% Fib at 1184.69 targets the 76.4% Fib at 1177.53.

Daily Chart - Created Using FXCM Marketscope
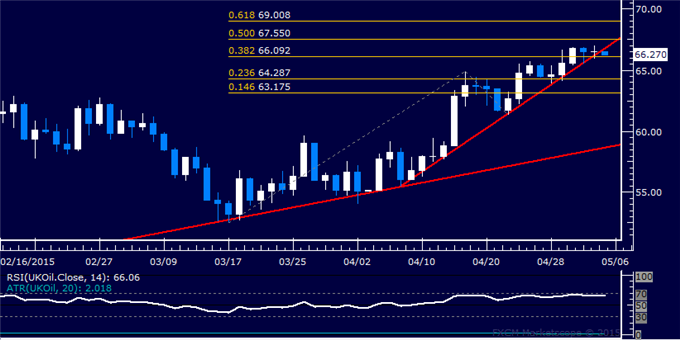
CRUDE OIL TECHNICAL ANALYSIS – Prices are digesting gains after rising to the highest level in five months. A break above the 50% Fibonacci expansion at 67.55 exposes the 61.8% level at 69.01. Alternatively, a move below the 38.2% Fib at 66.09 targets the 23.6% expansion at 64.29.
Daily Chart - Created Using FXCM Marketscope
--- Written by Ilya Spivak, Currency Strategist for DailyFX.com
To receive Ilya's analysis directly via email, please SIGN UP HERE
Contact and follow Ilya on Twitter: @IlyaSpivak
DailyFX provides forex news and technical analysis on the trends that influence the global currency markets.
Learn forex trading with a free practice account and trading charts from FXCM.
