
 Yahoo Finance
 Gold Digesting Losses, Crude Oil Selloff Stalls at 4-Month Support
DailyFX.com -
Talking Points:
US Dollar Hits Monthly High as Rally Extends for 5th Day
S&P 500 Waiting for Cues After Backing Off Record High
Crude Oil Drop Pauses at 4-Month Support, Gold Stalling
Can’t access the Dow Jones FXCM US Dollar Index? Try the USD basket on Mirror Trader. **
US DOLLAR TECHNICAL ANALYSIS – Prices continued to press upward, hitting the highest level in over a month. Near-term resistance is at 12037, the 76.4% Fibonacci retracement, with a break above that on a daily closing basis exposing the March 13 high at 12149. Alternatively, a reversal below the 61.8% Fib at 11960 opens the door for a challenge of the 50% retracement at 11898.
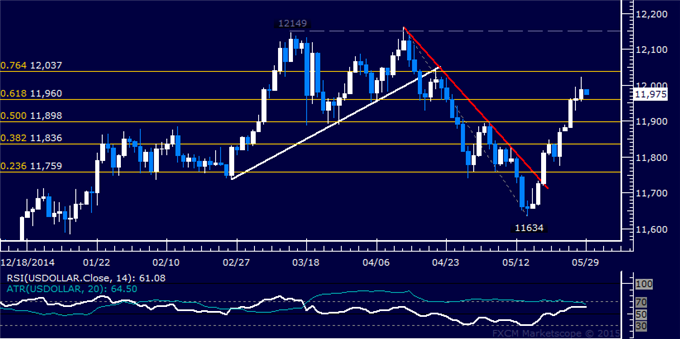
Daily Chart - Created Using FXCM Marketscope
** The Dow Jones FXCM US Dollar Index and the Mirror Trader USD basket are not the same product.
S&P 500 TECHNICAL ANALYSIS – Prices are in consolidation mode having set a record high last week. A break below the 2100.00-03.60 area (trend line, 38.2% Fibonacci retracement) exposes the 50% level at 2099.60. Alternatively, a reversal above downward-sloping resistance at 2127.30 targets the 38.2% Fib expansion at 2136.00.
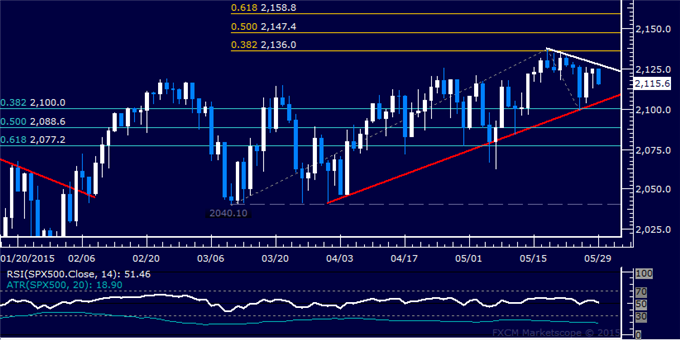
Daily Chart - Created Using FXCM Marketscope
GOLD TECHNICAL ANALYSIS – Prices are digesting losses after claiming a foothold below the $1200/oz figure anew. A close below range support at 1178.09 exposes the 38.2% Fibonacci expansion at 1169.31. Alternatively, a rebound above the 23.6% level at 1193.38 targets trend line support-turned-resistance at 1204.36.
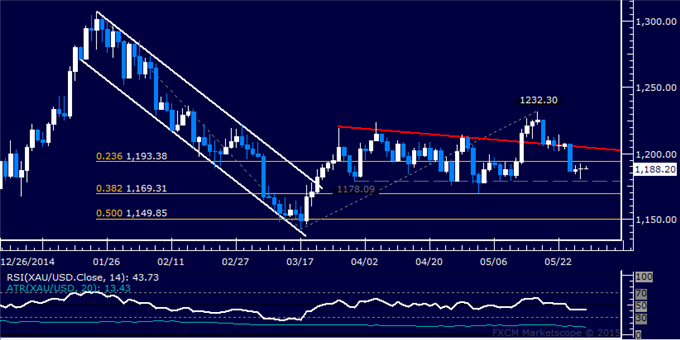
Daily Chart - Created Using FXCM Marketscope
CRUDE OIL TECHNICAL ANALYSIS – Prices paused to digest losses after testing support guiding the up move from lows set in mid-January. A break below a rising trend line at 61.29 exposes the 38.2% Fibonacci retracement at 60.27. Alternatively, a move the 23.6% level at 63.84 targets downward-sloping resistance at 66.16.
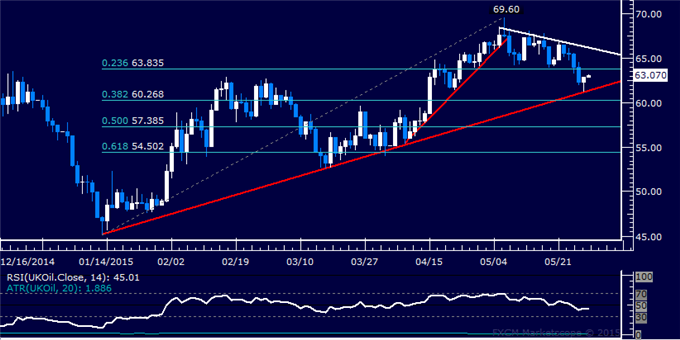
Daily Chart - Created Using FXCM Marketscope
--- Written by Ilya Spivak, Currency Strategist for DailyFX.com
To receive Ilya's analysis directly via email, please SIGN UP HERE
Contact and follow Ilya on Twitter: @IlyaSpivak
DailyFX provides forex news and technical analysis on the trends that influence the global currency markets.
Learn forex trading with a free practice account and trading charts from FXCM.
