
 Yahoo Finance
 Are GNC Holdings, Inc.’s (NYSE:GNC) High Returns Really That Great?

Today we'll evaluate GNC Holdings, Inc. (NYSE:GNC) to determine whether it could have potential as an investment idea. To be precise, we'll consider its Return On Capital Employed (ROCE), as that will inform our view of the quality of the business.
First of all, we'll work out how to calculate ROCE. Second, we'll look at its ROCE compared to similar companies. Last but not least, we'll look at what impact its current liabilities have on its ROCE.
Understanding Return On Capital Employed (ROCE)
ROCE is a metric for evaluating how much pre-tax income (in percentage terms) a company earns on the capital invested in its business. Generally speaking a higher ROCE is better. Ultimately, it is a useful but imperfect metric. Renowned investment researcher Michael Mauboussin has suggested that a high ROCE can indicate that 'one dollar invested in the company generates value of more than one dollar'.
How Do You Calculate Return On Capital Employed?
Analysts use this formula to calculate return on capital employed:
Return on Capital Employed = Earnings Before Interest and Tax (EBIT) ÷ (Total Assets - Current Liabilities)
Or for GNC Holdings:
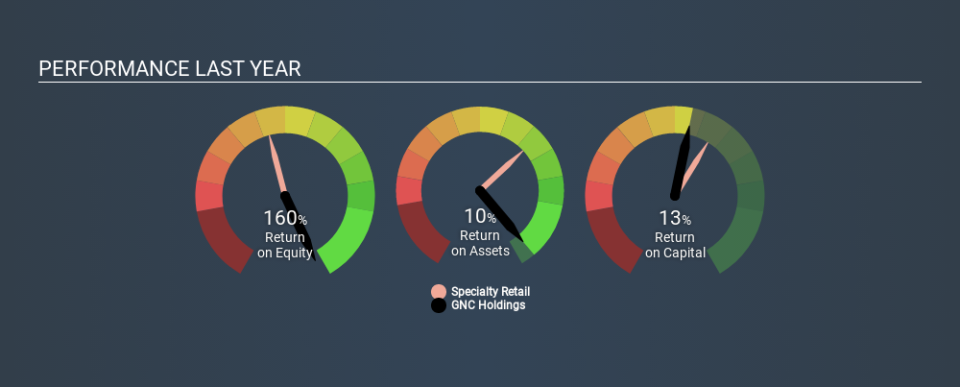
0.13 = US$154m ÷ (US$1.7b - US$532m) (Based on the trailing twelve months to September 2019.)
So, GNC Holdings has an ROCE of 13%.
See our latest analysis for GNC Holdings
Is GNC Holdings's ROCE Good?
ROCE can be useful when making comparisons, such as between similar companies. Using our data, we find that GNC Holdings's ROCE is meaningfully better than the 11% average in the Specialty Retail industry. I think that's good to see, since it implies the company is better than other companies at making the most of its capital. Separate from GNC Holdings's performance relative to its industry, its ROCE in absolute terms looks satisfactory, and it may be worth researching in more depth.
You can click on the image below to see (in greater detail) how GNC Holdings's past growth compares to other companies.
Remember that this metric is backwards looking - it shows what has happened in the past, and does not accurately predict the future. ROCE can be misleading for companies in cyclical industries, with returns looking impressive during the boom times, but very weak during the busts. ROCE is only a point-in-time measure. What happens in the future is pretty important for investors, so we have prepared a free report on analyst forecasts for GNC Holdings.
What Are Current Liabilities, And How Do They Affect GNC Holdings's ROCE?
Current liabilities are short term bills and invoices that need to be paid in 12 months or less. The ROCE equation subtracts current liabilities from capital employed, so a company with a lot of current liabilities appears to have less capital employed, and a higher ROCE than otherwise. To check the impact of this, we calculate if a company has high current liabilities relative to its total assets.
GNC Holdings has total liabilities of US$532m and total assets of US$1.7b. Therefore its current liabilities are equivalent to approximately 32% of its total assets. With this level of current liabilities, GNC Holdings's ROCE is boosted somewhat.
The Bottom Line On GNC Holdings's ROCE
While its ROCE looks good, it's worth remembering that the current liabilities are making the business look better. GNC Holdings shapes up well under this analysis, but it is far from the only business delivering excellent numbers . You might also want to check this free collection of companies delivering excellent earnings growth.
If you like to buy stocks alongside management, then you might just love this free list of companies. (Hint: insiders have been buying them).
If you spot an error that warrants correction, please contact the editor at editorial-team@simplywallst.com. This article by Simply Wall St is general in nature. It does not constitute a recommendation to buy or sell any stock, and does not take account of your objectives, or your financial situation. Simply Wall St has no position in the stocks mentioned.
We aim to bring you long-term focused research analysis driven by fundamental data. Note that our analysis may not factor in the latest price-sensitive company announcements or qualitative material. Thank you for reading.
