
 Yahoo Finance
 General Mills' (NYSE:GIS) investors will be pleased with their respectable 62% return over the last five years
When you buy and hold a stock for the long term, you definitely want it to provide a positive return. Better yet, you'd like to see the share price move up more than the market average. But General Mills, Inc. (NYSE:GIS) has fallen short of that second goal, with a share price rise of 38% over five years, which is below the market return. Unfortunately the share price is down 21% in the last year.
Let's take a look at the underlying fundamentals over the longer term, and see if they've been consistent with shareholders returns.
View our latest analysis for General Mills
To quote Buffett, 'Ships will sail around the world but the Flat Earth Society will flourish. There will continue to be wide discrepancies between price and value in the marketplace...' By comparing earnings per share (EPS) and share price changes over time, we can get a feel for how investor attitudes to a company have morphed over time.
Over half a decade, General Mills managed to grow its earnings per share at 12% a year. This EPS growth is higher than the 7% average annual increase in the share price. Therefore, it seems the market has become relatively pessimistic about the company.
The graphic below depicts how EPS has changed over time (unveil the exact values by clicking on the image).
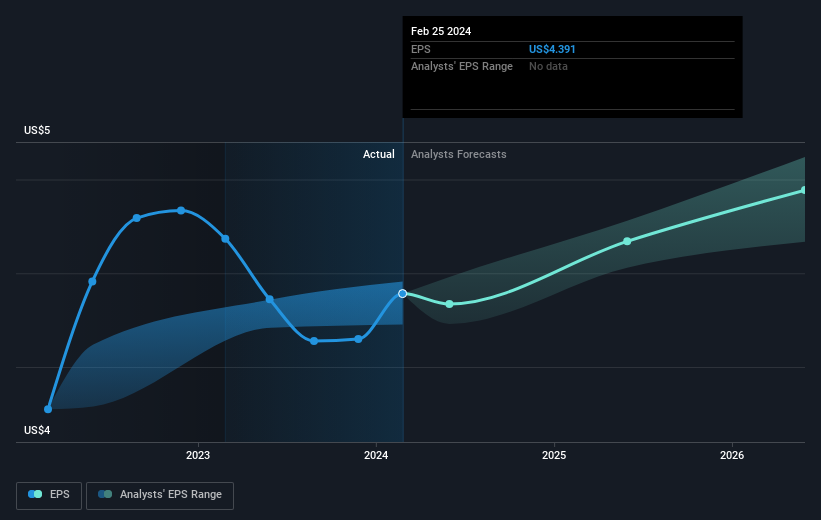
This free interactive report on General Mills' earnings, revenue and cash flow is a great place to start, if you want to investigate the stock further.
What About Dividends?
It is important to consider the total shareholder return, as well as the share price return, for any given stock. The TSR is a return calculation that accounts for the value of cash dividends (assuming that any dividend received was reinvested) and the calculated value of any discounted capital raisings and spin-offs. It's fair to say that the TSR gives a more complete picture for stocks that pay a dividend. We note that for General Mills the TSR over the last 5 years was 62%, which is better than the share price return mentioned above. This is largely a result of its dividend payments!
A Different Perspective
General Mills shareholders are down 18% for the year (even including dividends), but the market itself is up 24%. Even the share prices of good stocks drop sometimes, but we want to see improvements in the fundamental metrics of a business, before getting too interested. On the bright side, long term shareholders have made money, with a gain of 10% per year over half a decade. It could be that the recent sell-off is an opportunity, so it may be worth checking the fundamental data for signs of a long term growth trend. While it is well worth considering the different impacts that market conditions can have on the share price, there are other factors that are even more important. To that end, you should be aware of the 1 warning sign we've spotted with General Mills .
We will like General Mills better if we see some big insider buys. While we wait, check out this free list of growing companies with considerable, recent, insider buying.
Please note, the market returns quoted in this article reflect the market weighted average returns of stocks that currently trade on American exchanges.
Have feedback on this article? Concerned about the content? Get in touch with us directly. Alternatively, email editorial-team (at) simplywallst.com.
This article by Simply Wall St is general in nature. We provide commentary based on historical data and analyst forecasts only using an unbiased methodology and our articles are not intended to be financial advice. It does not constitute a recommendation to buy or sell any stock, and does not take account of your objectives, or your financial situation. We aim to bring you long-term focused analysis driven by fundamental data. Note that our analysis may not factor in the latest price-sensitive company announcements or qualitative material. Simply Wall St has no position in any stocks mentioned.
