GBP/USD Technical Analysis: Bouncing in a Fibonacci-Based Range
DailyFX.com -
To receive James Stanley’s Analysis directly via email, please sign up here.
Talking Points:
GBP/USD Technical Strategy: Near-term bullish prospects remain in GBP; GBP/USD range-bound despite the U.S. Dollar’s relentless top-side breakout.
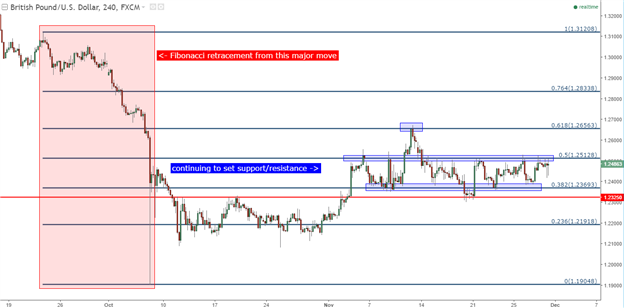
Cable is continuing to find support and resistance inflections off of the Fibonacci retracement that we discussed last week.
If you’re looking for trading ideas, check out our Trading Guides.
In our last article, we looked at the fact that despite the U.S. Dollar’s rampant run to fresh 13-year highs, GBP/USD remained largely unfettered. While the Dollar-surge was showing vividly as EUR/USD perched to fresh lows and USD/JPY to fresh highs; GBP/USD remained in a relatively consistent range, finding continued support at a well-trafficked zone of support that was prior resistance in the ‘post-Flash Crash’ environment.
Chart prepared by James Stanley
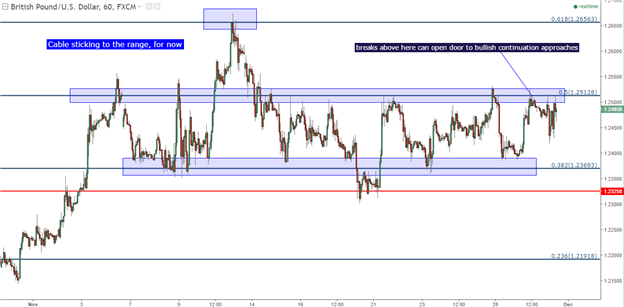
Since that last article, the U.S. Dollar has continued to punch-higher to find even higher-highs, and GBP/USD has remained in this range-bound formation. This can highlight the fact that, should USD-strength subside, long Cable could be a pretty excellent place to be voicing that theme, and the likely reason for this is what we’ve been talking about over the past few months regarding inflation expectations. After the ‘sharp repricing’ in GBP, it was just a matter of time before inflation began to show up on imported products. In short order, we heard of stories like ‘the Marmite crisis,’ or the rampant price increases on MacBook’s in the U.K.; and these just serve as individual examples of this theme playing out.
When a currency drops by 20%, as the British Pound did against the U.S. Dollar from June 23rd into early October, companies importing products into that economy are faced with a tough decision. Either raise prices, or take the 20% hit by selling products at the same prices as previous despite the drop in the exchange rate. As you might imagine, many of these producers aren’t nonsensical; so rather than watch their margins go up in smoke, they raise prices. And this is inflation… Inflation that makes the prospect of further rate cuts seem considerably less-likely.
In early November, we finally heard the Bank of England acknowledge this fact on Super Thursday, and matters haven’t been the same for the Sterling ever since. GBP has begun to show bullish tendencies as short-covering has turned into support-plays. And even with this near-historic move in the Greenback throughout the month of November, GBP/USD remains supported off the lows.
However – one hindrance to the continued top-side approach would be that rampant move in the U.S. Dollar. If you want to fade this move in the Greenback by selling the highs, GBP/USD could be an attractive place to do it. But with this move in USD, it can be difficult to muster the desire to fade such a move at this point. For those looking for more of a long-GBP play, traders may be best-served by looking elsewhere, such as GBP/JPY or perhaps even EUR/GBP.
Chart prepared by James Stanley
--- Written by James Stanley, Analyst for DailyFX.com
To receive James Stanley’s analysis directly via email, please SIGN UP HERE
Contact and follow James on Twitter: @JStanleyFX
DailyFX provides forex news and technical analysis on the trends that influence the global currency markets.
Learn forex trading with a free practice account and trading charts from IG.

 Yahoo Finance


