
 Yahoo Finance
 GBP/USD Daily Forecast – Sterling Breaks Upward, Trendline Resistance in Sight
GBP/USD Boosted by a Weaker Dollar
The US Dollar index (DXY) dropped to a fresh weekly low on Thursday, sending most of the major currencies a bit higher. While GBP/USD shows upward momentum, a major resistance area is within proximity.
Sterling advanced against the dollar despite a miss in UK retail sales on Thursday. The Office for National Statistics reported a decline of 0.1% in sales for October against an expected gain of 0.2%. Retail sales figures from the US will be reported later today.
The British pound is on pace to post the strongest weekly gain among the major currencies. However, GBP/USD has mostly been ranging since posting a high in late October. The pair has alternated between gains and losses for five straight weeks, presuming it holds on to the roughly three-quarters of a percent weekly gain it is currently showing.
Technical Analysis
The consolidation that took place for most of the week took the form of a bullish flag pattern. The upward break yesterday has provided a bullish signal and therefore I think the pair stands to extend higher.
However, there is some fairly important resistance in around 1.2925. A declining trendline comes into play in that area that is drawn connecting the late October high with the high printed at the start of the month.
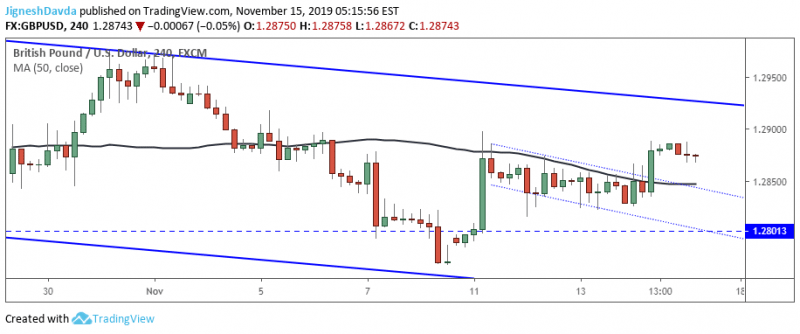
I think it is important to recognize that the pair has broken above it’s 50 moving average on a 4-hour chart alongside the bull flag break. This is an indicator that held it lower through the early week, including the surge higher on Monday.
I suspect the indicator will offer support on dips. The main hurdle for the session ahead will be the 1.2900 level followed by the mentioned resistance area around 1.2925.
Bottom Line
GBP/USD is signaling more upside after a break higher from a bullish flag pattern.
Major resistance is seen around 1.2925 from a declining trendline.
US retail sales will be reported later today and stands to drive volatility to the markets.
This article was originally posted on FX Empire