
 Yahoo Finance
 Gale Pacific Limited's (ASX:GAP) Low P/E No Reason For Excitement

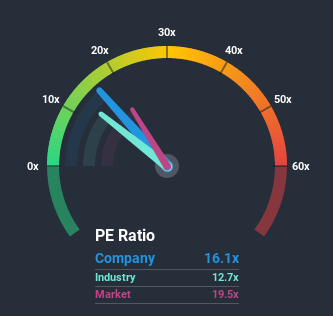
Gale Pacific Limited's (ASX:GAP) price-to-earnings (or "P/E") ratio of 16.1x might make it look like a buy right now compared to the market in Australia, where around half of the companies have P/E ratios above 20x and even P/E's above 38x are quite common. Nonetheless, we'd need to dig a little deeper to determine if there is a rational basis for the reduced P/E.
For instance, Gale Pacific's receding earnings in recent times would have to be some food for thought. It might be that many expect the disappointing earnings performance to continue or accelerate, which has repressed the P/E. If you like the company, you'd be hoping this isn't the case so that you could potentially pick up some stock while it's out of favour.
Check out our latest analysis for Gale Pacific
Want the full picture on earnings, revenue and cash flow for the company? Then our free report on Gale Pacific will help you shine a light on its historical performance.
Is There Any Growth For Gale Pacific?
There's an inherent assumption that a company should underperform the market for P/E ratios like Gale Pacific's to be considered reasonable.
Taking a look back first, the company's earnings per share growth last year wasn't something to get excited about as it posted a disappointing decline of 58%. Unfortunately, that's brought it right back to where it started three years ago with EPS growth being virtually non-existent overall during that time. Accordingly, shareholders probably wouldn't have been overly satisfied with the unstable medium-term growth rates.
Weighing that recent medium-term earnings trajectory against the broader market's one-year forecast for expansion of 21% shows it's noticeably less attractive on an annualised basis.
With this information, we can see why Gale Pacific is trading at a P/E lower than the market. It seems most investors are expecting to see the recent limited growth rates continue into the future and are only willing to pay a reduced amount for the stock.
The Final Word
It's argued the price-to-earnings ratio is an inferior measure of value within certain industries, but it can be a powerful business sentiment indicator.
We've established that Gale Pacific maintains its low P/E on the weakness of its recentthree-year growth being lower than the wider market forecast, as expected. Right now shareholders are accepting the low P/E as they concede future earnings probably won't provide any pleasant surprises. Unless the recent medium-term conditions improve, they will continue to form a barrier for the share price around these levels.
It's always necessary to consider the ever-present spectre of investment risk. We've identified 6 warning signs with Gale Pacific (at least 2 which can't be ignored), and understanding these should be part of your investment process.
Of course, you might also be able to find a better stock than Gale Pacific. So you may wish to see this free collection of other companies that sit on P/E's below 20x and have grown earnings strongly.
This article by Simply Wall St is general in nature. It does not constitute a recommendation to buy or sell any stock, and does not take account of your objectives, or your financial situation. We aim to bring you long-term focused analysis driven by fundamental data. Note that our analysis may not factor in the latest price-sensitive company announcements or qualitative material. Simply Wall St has no position in any stocks mentioned.
Have feedback on this article? Concerned about the content? Get in touch with us directly. Alternatively, email editorial-team@simplywallst.com.
