
 Yahoo Finance
 Gale Pacific Limited (ASX:GAP) Stock's Been Sliding But Fundamentals Look Decent: Will The Market Correct The Share Price In The Future?
With its stock down 16% over the past three months, it is easy to disregard Gale Pacific (ASX:GAP). But if you pay close attention, you might find that its key financial indicators look quite decent, which could mean that the stock could potentially rise in the long-term given how markets usually reward more resilient long-term fundamentals. Particularly, we will be paying attention to Gale Pacific's ROE today.
Return on Equity or ROE is a test of how effectively a company is growing its value and managing investors’ money. In short, ROE shows the profit each dollar generates with respect to its shareholder investments.
Check out our latest analysis for Gale Pacific
How Is ROE Calculated?
The formula for return on equity is:
Return on Equity = Net Profit (from continuing operations) ÷ Shareholders' Equity
So, based on the above formula, the ROE for Gale Pacific is:
13% = AU$12m ÷ AU$93m (Based on the trailing twelve months to June 2021).
The 'return' is the profit over the last twelve months. One way to conceptualize this is that for each A$1 of shareholders' capital it has, the company made A$0.13 in profit.
What Is The Relationship Between ROE And Earnings Growth?
Thus far, we have learned that ROE measures how efficiently a company is generating its profits. Based on how much of its profits the company chooses to reinvest or "retain", we are then able to evaluate a company's future ability to generate profits. Assuming everything else remains unchanged, the higher the ROE and profit retention, the higher the growth rate of a company compared to companies that don't necessarily bear these characteristics.
Gale Pacific's Earnings Growth And 13% ROE
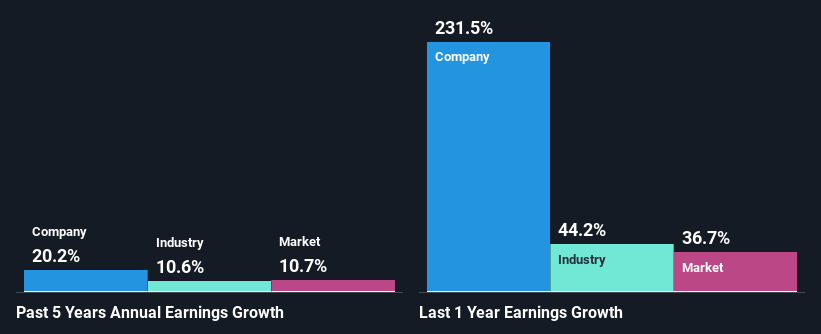
To begin with, Gale Pacific seems to have a respectable ROE. Be that as it may, the company's ROE is still quite lower than the industry average of 18%. That being the case, the significant five-year 20% net income growth reported by Gale Pacific comes as a pleasant surprise. We reckon that there could be other factors at play here. For example, it is possible that the company's management has made some good strategic decisions, or that the company has a low payout ratio. Bear in mind, the company does have a respectable ROE. It is just that the industry ROE is higher. So this certainly also provides some context to the high earnings growth seen by the company.
As a next step, we compared Gale Pacific's net income growth with the industry, and pleasingly, we found that the growth seen by the company is higher than the average industry growth of 11%.
Earnings growth is an important metric to consider when valuing a stock. It’s important for an investor to know whether the market has priced in the company's expected earnings growth (or decline). By doing so, they will have an idea if the stock is headed into clear blue waters or if swampy waters await. Is Gale Pacific fairly valued compared to other companies? These 3 valuation measures might help you decide.
Is Gale Pacific Using Its Retained Earnings Effectively?
The high three-year median payout ratio of 60% (implying that it keeps only 40% of profits) for Gale Pacific suggests that the company's growth wasn't really hampered despite it returning most of the earnings to its shareholders.
Besides, Gale Pacific has been paying dividends for at least ten years or more. This shows that the company is committed to sharing profits with its shareholders.
Summary
Overall, we feel that Gale Pacific certainly does have some positive factors to consider. Namely, its significant earnings growth, to which its moderate rate of return likely contributed. While the company is paying out most of its earnings as dividends, it has been able to grow its earnings in spite of it, so that's probably a good sign. Up till now, we've only made a short study of the company's growth data. To gain further insights into Gale Pacific's past profit growth, check out this visualization of past earnings, revenue and cash flows.
This article by Simply Wall St is general in nature. We provide commentary based on historical data and analyst forecasts only using an unbiased methodology and our articles are not intended to be financial advice. It does not constitute a recommendation to buy or sell any stock, and does not take account of your objectives, or your financial situation. We aim to bring you long-term focused analysis driven by fundamental data. Note that our analysis may not factor in the latest price-sensitive company announcements or qualitative material. Simply Wall St has no position in any stocks mentioned.
Have feedback on this article? Concerned about the content? Get in touch with us directly. Alternatively, email editorial-team (at) simplywallst.com.
