
 Yahoo Finance
 Gale Pacific (ASX:GAP) Will Be Looking To Turn Around Its Returns
When it comes to investing, there are some useful financial metrics that can warn us when a business is potentially in trouble. When we see a declining return on capital employed (ROCE) in conjunction with a declining base of capital employed, that's often how a mature business shows signs of aging. This combination can tell you that not only is the company investing less, it's earning less on what it does invest. So after glancing at the trends within Gale Pacific (ASX:GAP), we weren't too hopeful.
Return On Capital Employed (ROCE): What Is It?
For those who don't know, ROCE is a measure of a company's yearly pre-tax profit (its return), relative to the capital employed in the business. To calculate this metric for Gale Pacific, this is the formula:
Return on Capital Employed = Earnings Before Interest and Tax (EBIT) ÷ (Total Assets - Current Liabilities)
0.073 = AU$8.9m ÷ (AU$198m - AU$76m) (Based on the trailing twelve months to June 2023).
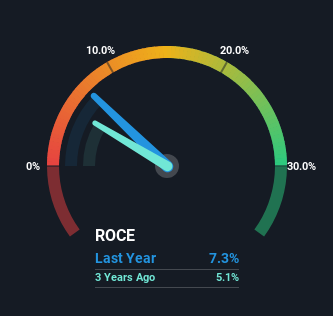
So, Gale Pacific has an ROCE of 7.3%. In absolute terms, that's a low return but it's around the Consumer Durables industry average of 7.8%.
View our latest analysis for Gale Pacific
While the past is not representative of the future, it can be helpful to know how a company has performed historically, which is why we have this chart above. If you're interested in investigating Gale Pacific's past further, check out this free graph of past earnings, revenue and cash flow.
What Can We Tell From Gale Pacific's ROCE Trend?
There is reason to be cautious about Gale Pacific, given the returns are trending downwards. Unfortunately the returns on capital have diminished from the 14% that they were earning five years ago. And on the capital employed front, the business is utilizing roughly the same amount of capital as it was back then. Since returns are falling and the business has the same amount of assets employed, this can suggest it's a mature business that hasn't had much growth in the last five years. If these trends continue, we wouldn't expect Gale Pacific to turn into a multi-bagger.
In Conclusion...
All in all, the lower returns from the same amount of capital employed aren't exactly signs of a compounding machine. It should come as no surprise then that the stock has fallen 16% over the last five years, so it looks like investors are recognizing these changes. Unless there is a shift to a more positive trajectory in these metrics, we would look elsewhere.
One more thing: We've identified 5 warning signs with Gale Pacific (at least 1 which is concerning) , and understanding these would certainly be useful.
While Gale Pacific may not currently earn the highest returns, we've compiled a list of companies that currently earn more than 25% return on equity. Check out this free list here.
Have feedback on this article? Concerned about the content? Get in touch with us directly. Alternatively, email editorial-team (at) simplywallst.com.
This article by Simply Wall St is general in nature. We provide commentary based on historical data and analyst forecasts only using an unbiased methodology and our articles are not intended to be financial advice. It does not constitute a recommendation to buy or sell any stock, and does not take account of your objectives, or your financial situation. We aim to bring you long-term focused analysis driven by fundamental data. Note that our analysis may not factor in the latest price-sensitive company announcements or qualitative material. Simply Wall St has no position in any stocks mentioned.
