
 Yahoo Finance
 FTSE 100 Technical Analysis: Trading Levels to Watch
DailyFX.com -
What’s inside:
The FTSE 100 bounces from a hair above eyed support zone
Unclear whether a renewed launch higher is under way yet
Trading levels to keep in mind
Analyst Forecasts and Education
On Monday, when we last looked at the FTSE 100 we noted the key support zone from 7130 (prior intra-day record high in October) to 7104 (prior intra-day record close in 2015). Buyers stepped in just 1.5 points ahead of the zone, with the daily low arriving at 7131.50 on Monday.
We’re seeing a good shove higher this morning after an uneventful day yesterday. We’ll look to the Monday low as our short-term line-in-the-sand, but a break won’t necessarily turn the picture bearish until we see a daily close below 7104 (we’ll call it 7100).
With that said, it’s unclear whether the FTSE can begin launching higher immediately. But giving the broader trend the benefit of the doubt, it’s hard to bet against higher prices until we see a break of material support by way of those old highs.
Short-term, we have our support zone in place. Looking at resistance on the upside the levels which we’ll focus on come in at ~7220, which is the 1/17 daily low/close and resistance on an intra-day bounce on 1/20, then the 1/18 day high of 7260. Beyond the 7240/7260 zone there is nothing visible until top-side trend-lines running back to 2013 and 2015 and record levels.
FTSE 100: Daily
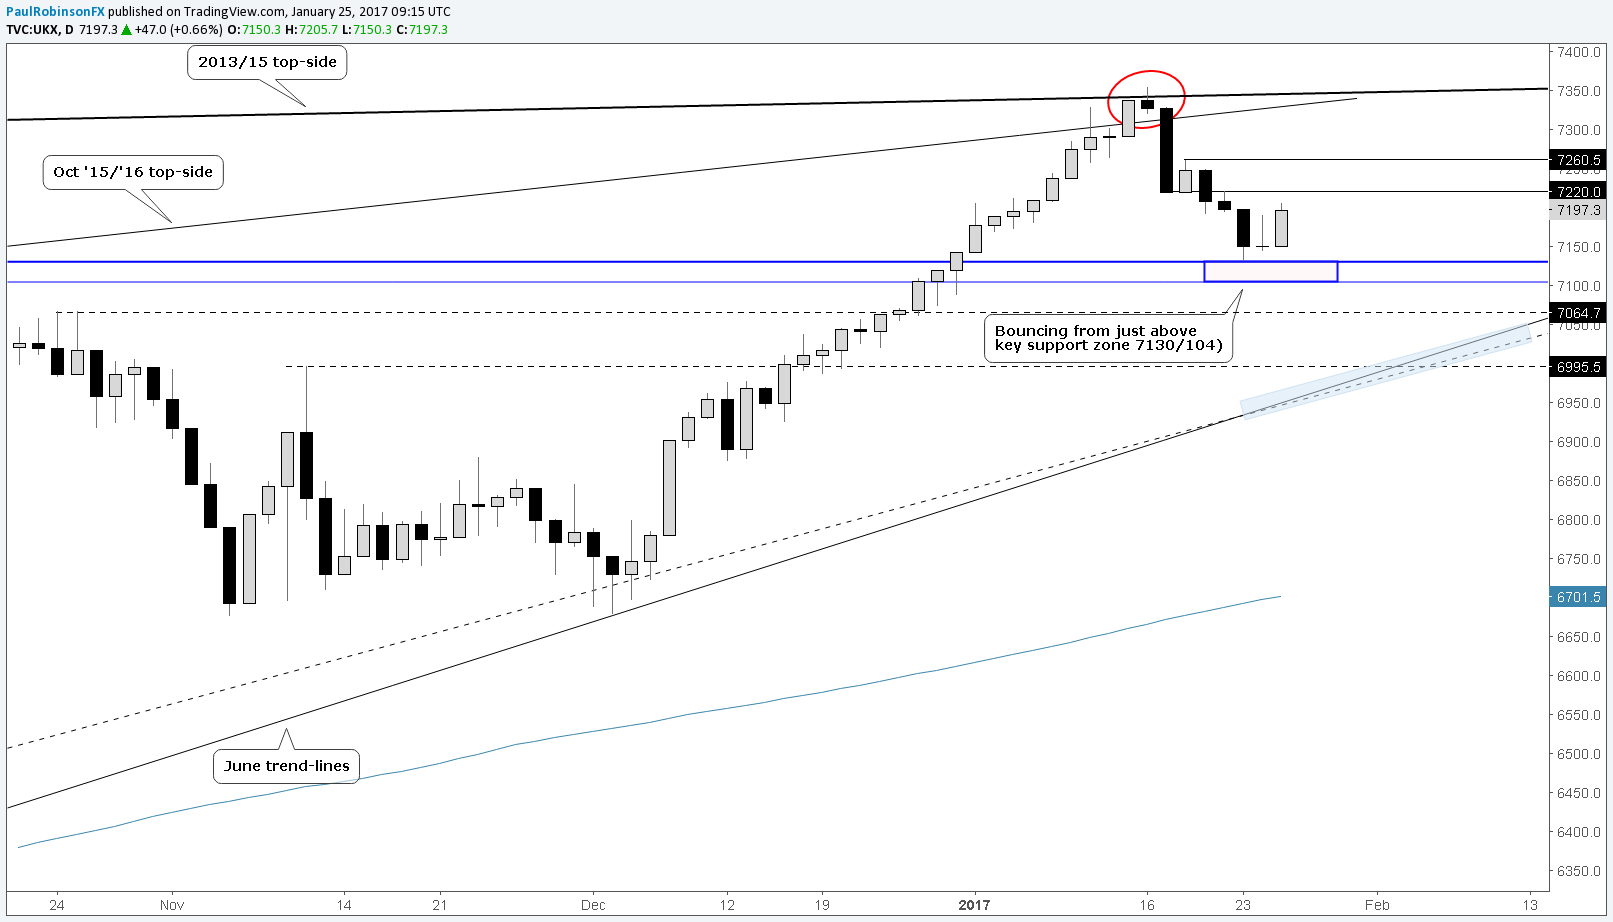
Created with Tradingview
See the Webinar Calendar or a schedule of upcoming live events with DailyFX analysts.
---Written by Paul Robinson, Market Analyst
You can receive Paul’s analysis directly via email by signing up here.
You can follow Paul on Twitter at @PaulRobinonFX.
DailyFX provides forex news and technical analysis on the trends that influence the global currency markets.
Learn forex trading with a free practice account and trading charts from IG.
