
 Yahoo Finance
 FTSE 100: Standoff at Record Highs
DailyFX.com -
What’s inside:
The FTSE 100 continues record closes in record fashion
Top-side trend-lines threaten the advance, but...
Need to be patient and wait for price to indicate a decline could be underway
DailyFX analysts’ Q1 forecasts are available on our Trading Guides page.
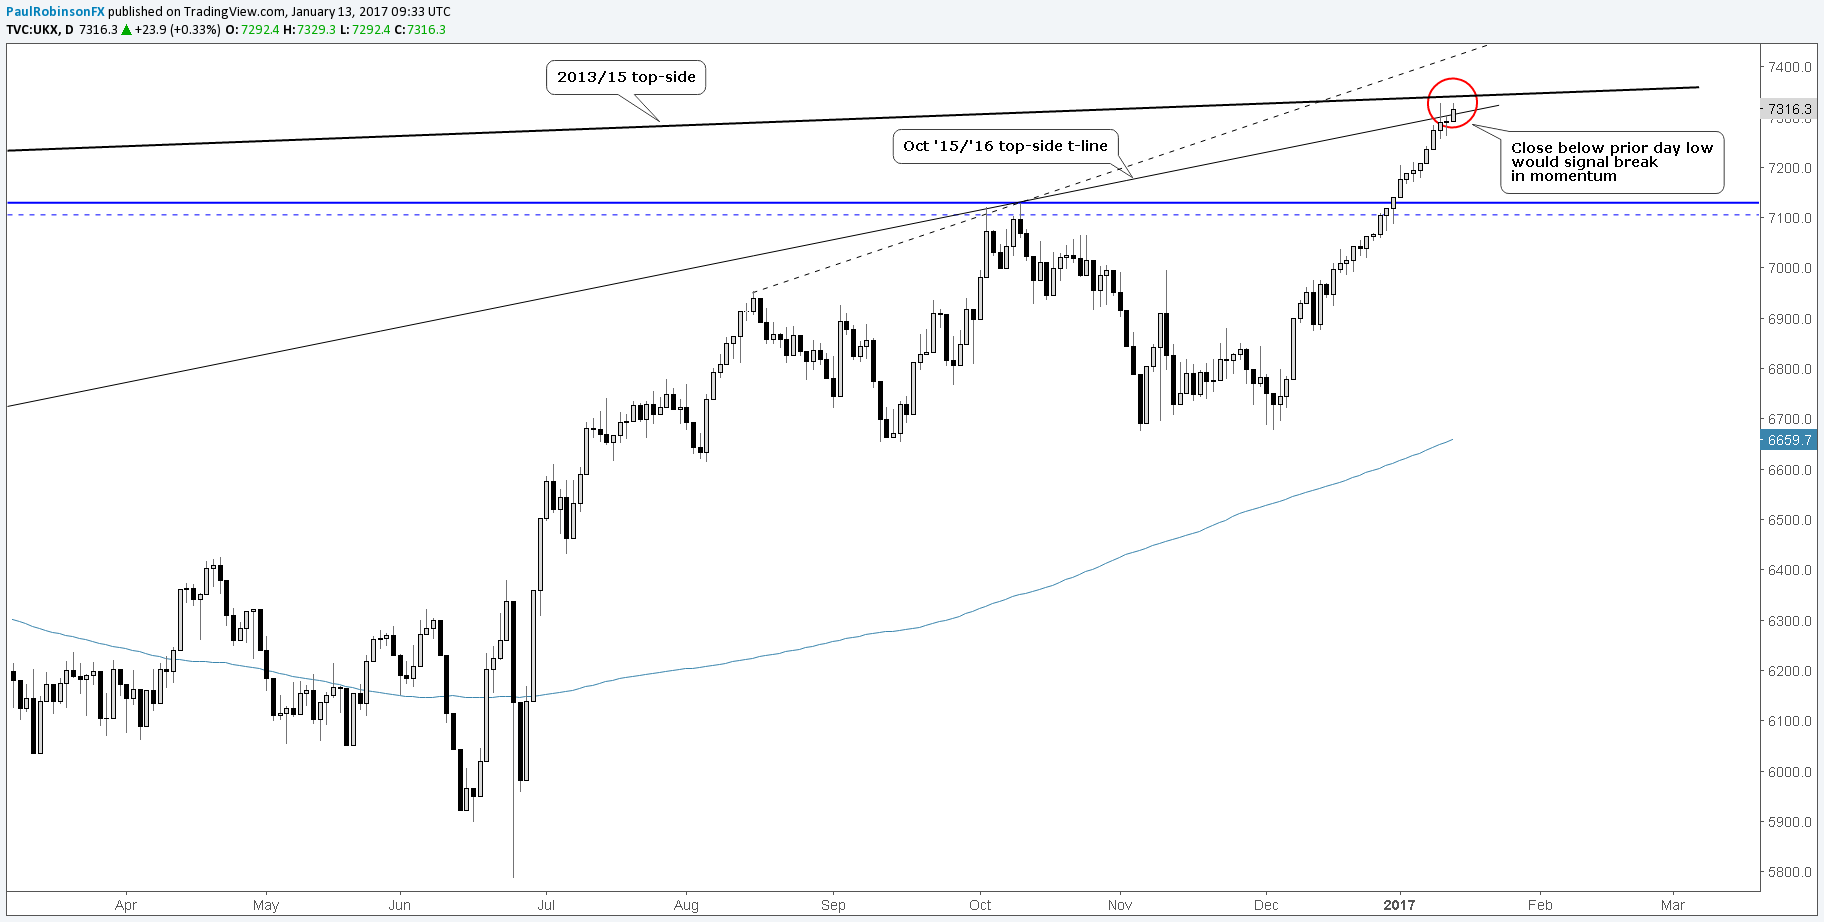
The FTSE 100 continues to make records in more than one way. The index has been notching out not only new record closing prices, but also doing so with the most consecutive record closes (11) since its inception in 1984. Consecutive closes in one direction or another isn’t, in of itself, an overbought/oversold indicator, but it certainly makes a market increasingly ripe for a reversal. And there is reason right in front of us to think the run is due for a set-back in the very near future.
The FTSE is trading at a confluence of top-side trend-lines. The first is the line crossing over the October 2015 and ‘16 highs. The second top-side trend-line goes back further to the peak in 2013 and crosses over the record highs in 2015. The two lines are separated by about 30 or 40 points, close enough to consider as confluence. If the market is able to extend beyond this intersection, there is another line extending higher from the August peak over the October high. The thinking on this end, is that the market won’t make that far on this push.
Fighting persistent uptrends from the short-side is a losing endeavor, so we will wait for price action to tell us when a break in the trend is taking shape. As we discussed the other day, a closing bar below the prior day low would be one signpost of a turn in momentum. This could be implemented as a trailing stop, as well, if you’ve been holding a long position.
FTSE 100: Daily
Created with Tradingview
Live events are held daily by our team of analysts, check out our Webinar Calendar for the upcoming schedule.
---Written by Paul Robinson, Market Analyst
You can receive Paul’s analysis directly via email by signing up here.
You can follow Paul on Twitter at @PaulRobinonFX.
DailyFX provides forex news and technical analysis on the trends that influence the global currency markets.
Learn forex trading with a free practice account and trading charts from IG.
