
 Yahoo Finance
 FTSE 100 Rests Above Critical Support Ahead of NFP
DailyFX.com -
Talking Points
The FTSE 100 remains bearish below yesterday’s high of 6154.
The bearish trend is challenging the multi-week trend, which has been in place since February.
A Bloomberg News survey projects the U.S. economy to have added 200k new jobs in the month of April.
The FTSE 100 (CFD: UK100) was little changed, at the time of writing, but the lull may end abruptly this afternoon as the monthly U.S. labor report is published.
As we will outline below, today’s session could be crucial for the FTSE 100 as the short-term bearish trend is now challenging the April 5 low of 6060, and thereby also challenging the bullish trend in place since February.
Technically, the FTSE 100 was short-term bearish below yesterday’s high of 6154, as it is the most recent high of a series of lower highs formed since the FTSE 100 reached the April 21 high of 6433. Resistance levels above yesterday’s high of 6154 are the intraday high of 6210, formed in the afternoon of May 3 and the April 27 high of 6341. According to classic technical analysis, for the bearish bias to soften, the price would need to stop creating lower highs and until this happens the trend is bearish. The next support level is the crucial level, the April 5 low of 6060.
The April 5 low of 6060 is the most recent swing low of the bullish trend in place since February 2016. Moreover, according to classic technical analysis, this longer-term trend will remain bullish as long as price trades above the April 5 low of 6060. However, on a failure of the low to hold as a support, the sequence of higher swing lows would end. We note that the support levels below the April 5 low of 6060 are the March 10 low of 6006, followed by the February 24 low of 5841. Today’s trading session could be crucial for the FTSE 100 and the outcome will most likely be influenced by the outcome of today’s monthly U.S. labor market report (NFP).
The outcome of the NFP does not only affect the U.S. stock markets, it affects most developed stock markets as the FTSE 100 and the DAX 30. A Bloomberg News survey projects that the U.S. economy is to have added 200k new jobs in the month of April. The report matching or beating economist’s expectations could be critical for the sentiment of stock market traders as more people employed could indicate firms are in a position to produce higher profits, and thereby lift share prices. A lower than expected reading may have the opposite effect. For more on the U.S. labor report, please read Strong Non-Farm Payrolls (NFP) Report to Fuel EUR/USD Weakness.
Our Stock Market forecasts for Q2 2016 are now live on the site. Download them for free.
FTSE 100 | CFD: UK100
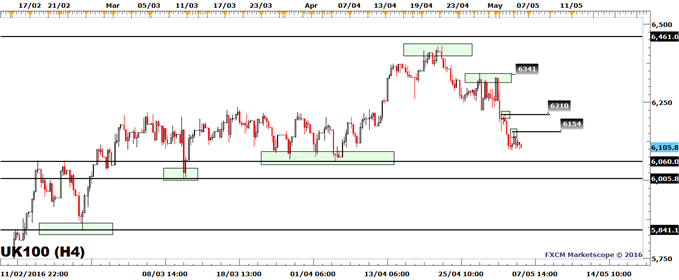
Created with Marketscope/Trading Station II; prepared by Alejandro Zambrano
--- Written by Alejandro Zambrano, Market Analyst for DailyFX.com
Contact and follow Alejandro on Twitter: @AlexFX00
DailyFX provides forex news and technical analysis on the trends that influence the global currency markets.
Learn forex trading with a free practice account and trading charts from FXCM.
