
 Yahoo Finance
 Are Frontier Digital Ventures Limited (ASX:FDV) Investors Paying Above The Intrinsic Value?
Key Insights
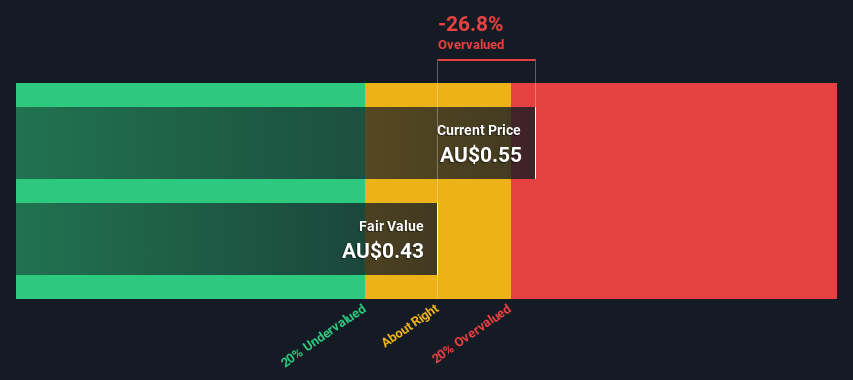
Frontier Digital Ventures' estimated fair value is AU$0.43 based on 2 Stage Free Cash Flow to Equity
Frontier Digital Ventures' AU$0.55 share price signals that it might be 27% overvalued
When compared to theindustry average discount of -40%, Frontier Digital Ventures' competitors seem to be trading at a greater premium to fair value
How far off is Frontier Digital Ventures Limited (ASX:FDV) from its intrinsic value? Using the most recent financial data, we'll take a look at whether the stock is fairly priced by taking the expected future cash flows and discounting them to today's value. One way to achieve this is by employing the Discounted Cash Flow (DCF) model. Models like these may appear beyond the comprehension of a lay person, but they're fairly easy to follow.
We would caution that there are many ways of valuing a company and, like the DCF, each technique has advantages and disadvantages in certain scenarios. If you still have some burning questions about this type of valuation, take a look at the Simply Wall St analysis model.
View our latest analysis for Frontier Digital Ventures
The Model
We are going to use a two-stage DCF model, which, as the name states, takes into account two stages of growth. The first stage is generally a higher growth period which levels off heading towards the terminal value, captured in the second 'steady growth' period. To start off with, we need to estimate the next ten years of cash flows. Where possible we use analyst estimates, but when these aren't available we extrapolate the previous free cash flow (FCF) from the last estimate or reported value. We assume companies with shrinking free cash flow will slow their rate of shrinkage, and that companies with growing free cash flow will see their growth rate slow, over this period. We do this to reflect that growth tends to slow more in the early years than it does in later years.
Generally we assume that a dollar today is more valuable than a dollar in the future, so we need to discount the sum of these future cash flows to arrive at a present value estimate:
10-year free cash flow (FCF) forecast
2024 | 2025 | 2026 | 2027 | 2028 | 2029 | 2030 | 2031 | 2032 | 2033 | |
Levered FCF (A$, Millions) | AU$2.00m | AU$5.60m | AU$8.20m | AU$10.2m | AU$12.1m | AU$13.7m | AU$15.1m | AU$16.3m | AU$17.3m | AU$18.1m |
Growth Rate Estimate Source | Analyst x1 | Analyst x1 | Analyst x1 | Est @ 24.96% | Est @ 18.15% | Est @ 13.38% | Est @ 10.05% | Est @ 7.71% | Est @ 6.07% | Est @ 4.93% |
Present Value (A$, Millions) Discounted @ 8.9% | AU$1.8 | AU$4.7 | AU$6.3 | AU$7.3 | AU$7.9 | AU$8.2 | AU$8.3 | AU$8.2 | AU$8.0 | AU$7.7 |
("Est" = FCF growth rate estimated by Simply Wall St)
Present Value of 10-year Cash Flow (PVCF) = AU$68m
After calculating the present value of future cash flows in the initial 10-year period, we need to calculate the Terminal Value, which accounts for all future cash flows beyond the first stage. The Gordon Growth formula is used to calculate Terminal Value at a future annual growth rate equal to the 5-year average of the 10-year government bond yield of 2.3%. We discount the terminal cash flows to today's value at a cost of equity of 8.9%.
Terminal Value (TV)= FCF2033 × (1 + g) ÷ (r – g) = AU$18m× (1 + 2.3%) ÷ (8.9%– 2.3%) = AU$277m
Present Value of Terminal Value (PVTV)= TV / (1 + r)10= AU$277m÷ ( 1 + 8.9%)10= AU$118m
The total value, or equity value, is then the sum of the present value of the future cash flows, which in this case is AU$186m. In the final step we divide the equity value by the number of shares outstanding. Compared to the current share price of AU$0.5, the company appears slightly overvalued at the time of writing. The assumptions in any calculation have a big impact on the valuation, so it is better to view this as a rough estimate, not precise down to the last cent.
The Assumptions
Now the most important inputs to a discounted cash flow are the discount rate, and of course, the actual cash flows. If you don't agree with these result, have a go at the calculation yourself and play with the assumptions. The DCF also does not consider the possible cyclicality of an industry, or a company's future capital requirements, so it does not give a full picture of a company's potential performance. Given that we are looking at Frontier Digital Ventures as potential shareholders, the cost of equity is used as the discount rate, rather than the cost of capital (or weighted average cost of capital, WACC) which accounts for debt. In this calculation we've used 8.9%, which is based on a levered beta of 1.051. Beta is a measure of a stock's volatility, compared to the market as a whole. We get our beta from the industry average beta of globally comparable companies, with an imposed limit between 0.8 and 2.0, which is a reasonable range for a stable business.
SWOT Analysis for Frontier Digital Ventures
Strength
Debt is not viewed as a risk.
Weakness
Expensive based on P/S ratio and estimated fair value.
Shareholders have been diluted in the past year.
Opportunity
Forecast to reduce losses next year.
Has sufficient cash runway for more than 3 years based on current free cash flows.
Threat
No apparent threats visible for FDV.
Moving On:
Although the valuation of a company is important, it shouldn't be the only metric you look at when researching a company. The DCF model is not a perfect stock valuation tool. Rather it should be seen as a guide to "what assumptions need to be true for this stock to be under/overvalued?" For instance, if the terminal value growth rate is adjusted slightly, it can dramatically alter the overall result. Can we work out why the company is trading at a premium to intrinsic value? For Frontier Digital Ventures, we've put together three relevant items you should further research:
Risks: Case in point, we've spotted 1 warning sign for Frontier Digital Ventures you should be aware of.
Future Earnings: How does FDV's growth rate compare to its peers and the wider market? Dig deeper into the analyst consensus number for the upcoming years by interacting with our free analyst growth expectation chart.
Other Solid Businesses: Low debt, high returns on equity and good past performance are fundamental to a strong business. Why not explore our interactive list of stocks with solid business fundamentals to see if there are other companies you may not have considered!
PS. The Simply Wall St app conducts a discounted cash flow valuation for every stock on the ASX every day. If you want to find the calculation for other stocks just search here.
Have feedback on this article? Concerned about the content? Get in touch with us directly. Alternatively, email editorial-team (at) simplywallst.com.
This article by Simply Wall St is general in nature. We provide commentary based on historical data and analyst forecasts only using an unbiased methodology and our articles are not intended to be financial advice. It does not constitute a recommendation to buy or sell any stock, and does not take account of your objectives, or your financial situation. We aim to bring you long-term focused analysis driven by fundamental data. Note that our analysis may not factor in the latest price-sensitive company announcements or qualitative material. Simply Wall St has no position in any stocks mentioned.
