
 Yahoo Finance
 Forex Strategy - USD/CAD Hammer Hints At Continued Consolidation
Talking Points
USD/CAD Technical Strategy: Sidelines preferred
Range on the daily remains in force (1.0900 – 1.1200)
Hammer on the four hour chart hints at a bounce ahead
A Bullish Engulfing formation on the daily chart for USD/CAD is hinting some strength for the pair following a failure to hold below the psychologically-significant 1.1000 handle. However, follow-through has been limited at this stage which suggests the bulls may struggle to push prices back to the 2014 highs at 1.1200.
USD/CAD: Upside Momentum Fading
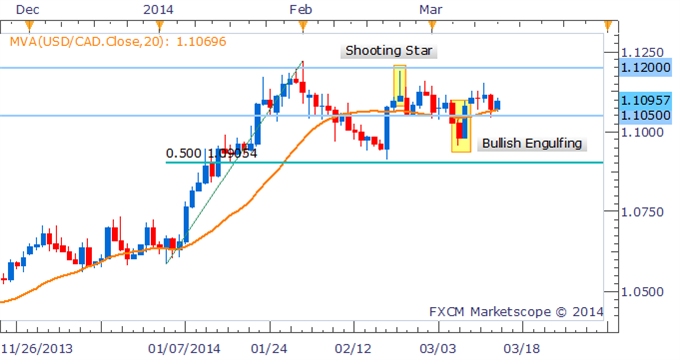
Daily Chart - Created Using FXCM Marketscope 2.0
As noted in yesterday’s report buyers were likely to keep prices supported at the 50% Fib Retracement Level during intraday trade. This has resulted in the formation of a Hammer candlestick which is indicating the possibility of a bounce in the session ahead.
USD/CAD: Hammer Hints At Bounce
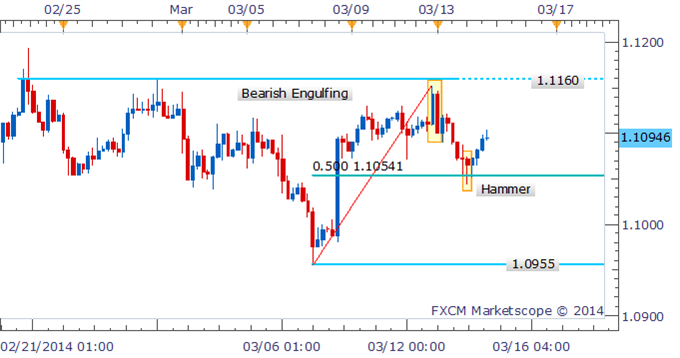
4 Hour Chart - Created Using FXCM Marketscope 2.0
By David de Ferranti, Market Analyst, FXCM
Follow David on Twitter: @Davidde
To receive David’s analysis directly via email, please sign up here.
DailyFX provides forex news and technical analysis on the trends that influence the global currency markets.
Learn forex trading with a free practice account and trading charts from FXCM.
