
 Yahoo Finance
 Forex Strategy: GBP/USD - 1.6670 Mark Puts Brakes On Rally
Talking Points
GBP/USD Technical Strategy: Sidelines preferred
Dojis signal indecision amongst traders in intraday trade
Daily remains void of bearish reversal pattern
Following a dip back towards the 1.6600 handle the GBP/USD bulls managed to regain their grip on the pair by the close of trading, resulting in a Doji candlestick formation on the daily. However, the failure to close above resistance at 1.6670 signals some indecision amongst traders and puts further gains into doubt.
GBP/USD: Doji Signals Indecision Near 1.6660/70 mark
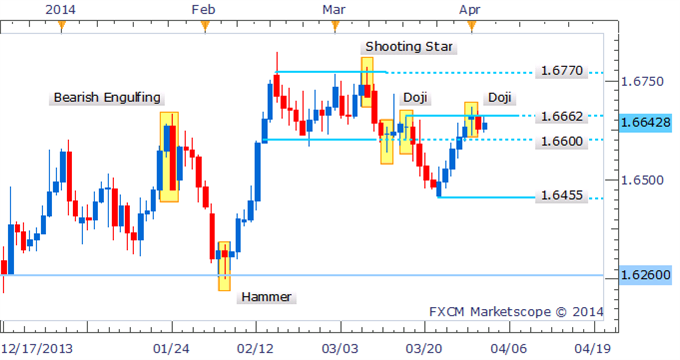
Daily Chart - Created Using FXCM Marketscope 2.0
Similarly on the four hour chart; several Dojis during intraday trade are further evidence that traders are hesitant to sway prices in one particular direction, leaving a neutral technical bias.
GBP/USD: Dojis Denote Deliberation Amongst Traders
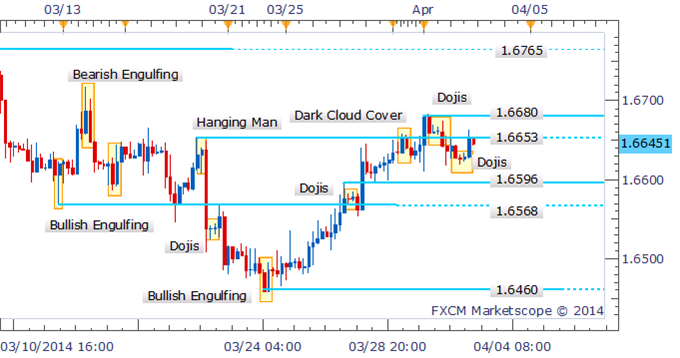
4 Hour Chart - Created Using FXCM Marketscope 2.0
The ominous Dark Cloud Cover formation on the weekly at multi-year resistance also remains on the radar, and is threatening a more significant correction ahead for the Pound. A potential target is offered by the 23.6% Fib Retracement Level near 1.6350. However, a Piercing Line pattern has also recently emerged and although it awaits confirmation, it suggests the bulls haven’t given up on the pair just yet.
GBP/USD: Bulls Return As Piercing Line Forms on Weekly
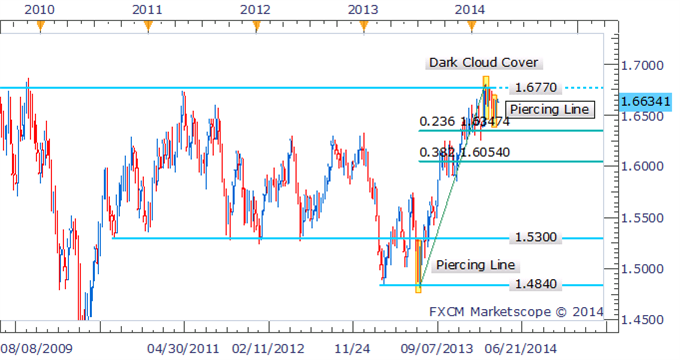
Weekly Chart - Created Using FXCM Marketscope 2.0
By David de Ferranti, Market Analyst, FXCM
Follow David on Twitter: @Davidde
To receive David’s analysis directly via email, please sign up here.
DailyFX provides forex news and technical analysis on the trends that influence the global currency markets.
Learn forex trading with a free practice account and trading charts from FXCM.
