
 Yahoo Finance
 Fletcher Building (NZSE:FBU) shareholders have endured a 36% loss from investing in the stock three years ago
For many investors, the main point of stock picking is to generate higher returns than the overall market. But in any portfolio, there are likely to be some stocks that fall short of that benchmark. Unfortunately, that's been the case for longer term Fletcher Building Limited (NZSE:FBU) shareholders, since the share price is down 47% in the last three years, falling well short of the market decline of around 8.7%. Furthermore, it's down 19% in about a quarter. That's not much fun for holders.
Since shareholders are down over the longer term, lets look at the underlying fundamentals over the that time and see if they've been consistent with returns.
Check out our latest analysis for Fletcher Building
There is no denying that markets are sometimes efficient, but prices do not always reflect underlying business performance. One way to examine how market sentiment has changed over time is to look at the interaction between a company's share price and its earnings per share (EPS).
During five years of share price growth, Fletcher Building moved from a loss to profitability. That would generally be considered a positive, so we are surprised to see the share price is down. So given the share price is down it's worth checking some other metrics too.
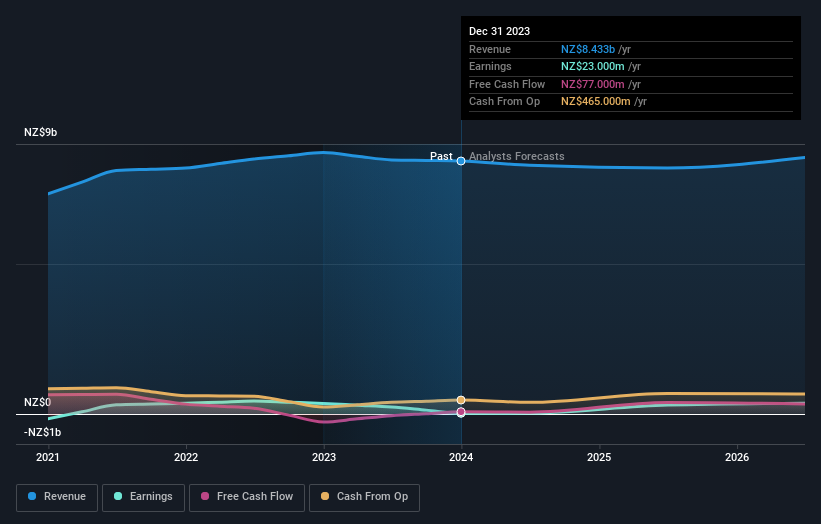
We note that, in three years, revenue has actually grown at a 3.8% annual rate, so that doesn't seem to be a reason to sell shares. It's probably worth investigating Fletcher Building further; while we may be missing something on this analysis, there might also be an opportunity.
The graphic below depicts how earnings and revenue have changed over time (unveil the exact values by clicking on the image).
We consider it positive that insiders have made significant purchases in the last year. Even so, future earnings will be far more important to whether current shareholders make money. This free report showing analyst forecasts should help you form a view on Fletcher Building
What About The Total Shareholder Return (TSR)?
We'd be remiss not to mention the difference between Fletcher Building's total shareholder return (TSR) and its share price return. The TSR is a return calculation that accounts for the value of cash dividends (assuming that any dividend received was reinvested) and the calculated value of any discounted capital raisings and spin-offs. Its history of dividend payouts mean that Fletcher Building's TSR, which was a 36% drop over the last 3 years, was not as bad as the share price return.
A Different Perspective
While the broader market lost about 1.0% in the twelve months, Fletcher Building shareholders did even worse, losing 11%. Having said that, it's inevitable that some stocks will be oversold in a falling market. The key is to keep your eyes on the fundamental developments. Regrettably, last year's performance caps off a bad run, with the shareholders facing a total loss of 0.8% per year over five years. Generally speaking long term share price weakness can be a bad sign, though contrarian investors might want to research the stock in hope of a turnaround. While it is well worth considering the different impacts that market conditions can have on the share price, there are other factors that are even more important. Even so, be aware that Fletcher Building is showing 4 warning signs in our investment analysis , you should know about...
Fletcher Building is not the only stock insiders are buying. So take a peek at this free list of growing companies with insider buying.
Please note, the market returns quoted in this article reflect the market weighted average returns of stocks that currently trade on New Zealander exchanges.
Have feedback on this article? Concerned about the content? Get in touch with us directly. Alternatively, email editorial-team (at) simplywallst.com.
This article by Simply Wall St is general in nature. We provide commentary based on historical data and analyst forecasts only using an unbiased methodology and our articles are not intended to be financial advice. It does not constitute a recommendation to buy or sell any stock, and does not take account of your objectives, or your financial situation. We aim to bring you long-term focused analysis driven by fundamental data. Note that our analysis may not factor in the latest price-sensitive company announcements or qualitative material. Simply Wall St has no position in any stocks mentioned.
