
 Yahoo Finance
 What Is Fleetwood's (ASX:FWD) P/E Ratio After Its Share Price Tanked?

To the annoyance of some shareholders, Fleetwood (ASX:FWD) shares are down a considerable 34% in the last month. That drop has capped off a tough year for shareholders, with the share price down 32% in that time.
Assuming nothing else has changed, a lower share price makes a stock more attractive to potential buyers. While the market sentiment towards a stock is very changeable, in the long run, the share price will tend to move in the same direction as earnings per share. So, on certain occasions, long term focussed investors try to take advantage of pessimistic expectations to buy shares at a better price. One way to gauge market expectations of a stock is to look at its Price to Earnings Ratio (PE Ratio). A high P/E implies that investors have high expectations of what a company can achieve compared to a company with a low P/E ratio.
See our latest analysis for Fleetwood
How Does Fleetwood's P/E Ratio Compare To Its Peers?
We can tell from its P/E ratio of 10.69 that sentiment around Fleetwood isn't particularly high. We can see in the image below that the average P/E (11.8) for companies in the consumer durables industry is higher than Fleetwood's P/E.
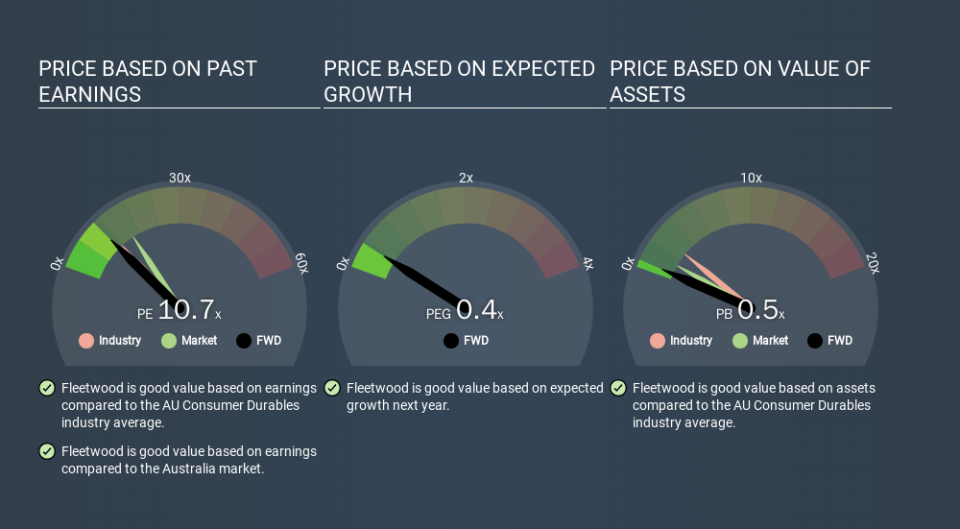
This suggests that market participants think Fleetwood will underperform other companies in its industry. Since the market seems unimpressed with Fleetwood, it's quite possible it could surprise on the upside. If you consider the stock interesting, further research is recommended. For example, I often monitor director buying and selling.
How Growth Rates Impact P/E Ratios
Probably the most important factor in determining what P/E a company trades on is the earnings growth. That's because companies that grow earnings per share quickly will rapidly increase the 'E' in the equation. Therefore, even if you pay a high multiple of earnings now, that multiple will become lower in the future. Then, a lower P/E should attract more buyers, pushing the share price up.
Fleetwood saw earnings per share decrease by 43% last year. But it has grown its earnings per share by 95% per year over the last five years.
Don't Forget: The P/E Does Not Account For Debt or Bank Deposits
The 'Price' in P/E reflects the market capitalization of the company. In other words, it does not consider any debt or cash that the company may have on the balance sheet. Theoretically, a business can improve its earnings (and produce a lower P/E in the future) by investing in growth. That means taking on debt (or spending its cash).
Spending on growth might be good or bad a few years later, but the point is that the P/E ratio does not account for the option (or lack thereof).
So What Does Fleetwood's Balance Sheet Tell Us?
Fleetwood has net cash of AU$29m. This is fairly high at 21% of its market capitalization. That might mean balance sheet strength is important to the business, but should also help push the P/E a bit higher than it would otherwise be.
The Bottom Line On Fleetwood's P/E Ratio
Fleetwood's P/E is 10.7 which is below average (15.9) in the AU market. Falling earnings per share are likely to be keeping potential buyers away, but the net cash position means the company has time to improve: if so, the low P/E could be an opportunity. Given Fleetwood's P/E ratio has declined from 16.2 to 10.7 in the last month, we know for sure that the market is significantly less confident about the business today, than it was back then. For those who prefer to invest with the flow of momentum, that might be a bad sign, but for a contrarian, it may signal opportunity.
Investors have an opportunity when market expectations about a stock are wrong. If it is underestimating a company, investors can make money by buying and holding the shares until the market corrects itself. So this free visual report on analyst forecasts could hold the key to an excellent investment decision.
But note: Fleetwood may not be the best stock to buy. So take a peek at this free list of interesting companies with strong recent earnings growth (and a P/E ratio below 20).
If you spot an error that warrants correction, please contact the editor at editorial-team@simplywallst.com. This article by Simply Wall St is general in nature. It does not constitute a recommendation to buy or sell any stock, and does not take account of your objectives, or your financial situation. Simply Wall St has no position in the stocks mentioned.
We aim to bring you long-term focused research analysis driven by fundamental data. Note that our analysis may not factor in the latest price-sensitive company announcements or qualitative material. Thank you for reading.
