
 Yahoo Finance
 Fleetwood (ASX:FWD) Has More To Do To Multiply In Value Going Forward
There are a few key trends to look for if we want to identify the next multi-bagger. Typically, we'll want to notice a trend of growing return on capital employed (ROCE) and alongside that, an expanding base of capital employed. This shows us that it's a compounding machine, able to continually reinvest its earnings back into the business and generate higher returns. However, after briefly looking over the numbers, we don't think Fleetwood (ASX:FWD) has the makings of a multi-bagger going forward, but let's have a look at why that may be.
What Is Return On Capital Employed (ROCE)?
If you haven't worked with ROCE before, it measures the 'return' (pre-tax profit) a company generates from capital employed in its business. Analysts use this formula to calculate it for Fleetwood:
Return on Capital Employed = Earnings Before Interest and Tax (EBIT) ÷ (Total Assets - Current Liabilities)
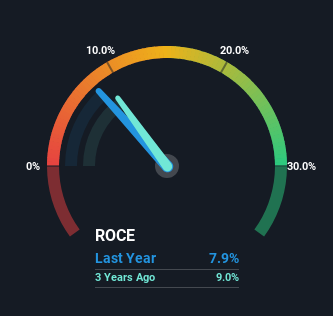
0.079 = AU$15m ÷ (AU$272m - AU$87m) (Based on the trailing twelve months to December 2023).
Thus, Fleetwood has an ROCE of 7.9%. In absolute terms, that's a low return and it also under-performs the Consumer Durables industry average of 16%.
View our latest analysis for Fleetwood
In the above chart we have measured Fleetwood's prior ROCE against its prior performance, but the future is arguably more important. If you'd like to see what analysts are forecasting going forward, you should check out our free analyst report for Fleetwood .
What Can We Tell From Fleetwood's ROCE Trend?
We've noticed that although returns on capital are flat over the last five years, the amount of capital employed in the business has fallen 25% in that same period. This indicates to us that assets are being sold and thus the business is likely shrinking, which you'll remember isn't the typical ingredients for an up-and-coming multi-bagger. Not only that, but the low returns on this capital mentioned earlier would leave most investors unimpressed.
The Bottom Line
Overall, we're not ecstatic to see Fleetwood reducing the amount of capital it employs in the business. Unsurprisingly, the stock has only gained 22% over the last five years, which potentially indicates that investors are accounting for this going forward. As a result, if you're hunting for a multi-bagger, we think you'd have more luck elsewhere.
While Fleetwood doesn't shine too bright in this respect, it's still worth seeing if the company is trading at attractive prices. You can find that out with our FREE intrinsic value estimation for FWD on our platform.
While Fleetwood may not currently earn the highest returns, we've compiled a list of companies that currently earn more than 25% return on equity. Check out this free list here.
Have feedback on this article? Concerned about the content? Get in touch with us directly. Alternatively, email editorial-team (at) simplywallst.com.
This article by Simply Wall St is general in nature. We provide commentary based on historical data and analyst forecasts only using an unbiased methodology and our articles are not intended to be financial advice. It does not constitute a recommendation to buy or sell any stock, and does not take account of your objectives, or your financial situation. We aim to bring you long-term focused analysis driven by fundamental data. Note that our analysis may not factor in the latest price-sensitive company announcements or qualitative material. Simply Wall St has no position in any stocks mentioned.
