
 Yahoo Finance
 Do Its Financials Have Any Role To Play In Driving Step One Clothing Limited's (ASX:STP) Stock Up Recently?
Step One Clothing (ASX:STP) has had a great run on the share market with its stock up by a significant 37% over the last three months. Given that stock prices are usually aligned with a company's financial performance in the long-term, we decided to study its financial indicators more closely to see if they had a hand to play in the recent price move. Specifically, we decided to study Step One Clothing's ROE in this article.
ROE or return on equity is a useful tool to assess how effectively a company can generate returns on the investment it received from its shareholders. In short, ROE shows the profit each dollar generates with respect to its shareholder investments.
Check out our latest analysis for Step One Clothing
How To Calculate Return On Equity?
The formula for ROE is:
Return on Equity = Net Profit (from continuing operations) ÷ Shareholders' Equity
So, based on the above formula, the ROE for Step One Clothing is:
19% = AU$10m ÷ AU$55m (Based on the trailing twelve months to December 2023).
The 'return' refers to a company's earnings over the last year. That means that for every A$1 worth of shareholders' equity, the company generated A$0.19 in profit.
What Has ROE Got To Do With Earnings Growth?
Thus far, we have learned that ROE measures how efficiently a company is generating its profits. Depending on how much of these profits the company reinvests or "retains", and how effectively it does so, we are then able to assess a company’s earnings growth potential. Assuming all else is equal, companies that have both a higher return on equity and higher profit retention are usually the ones that have a higher growth rate when compared to companies that don't have the same features.
Step One Clothing's Earnings Growth And 19% ROE
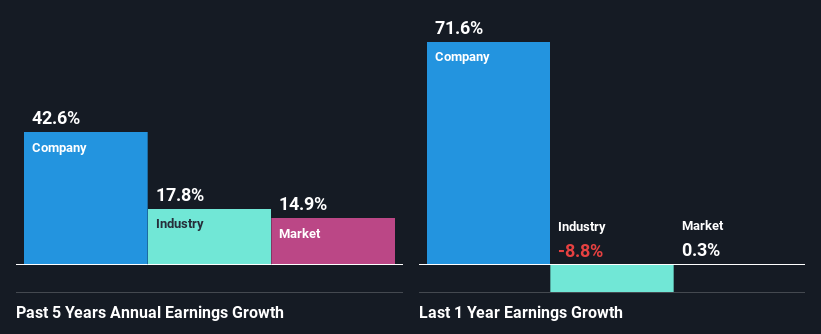
At first glance, Step One Clothing seems to have a decent ROE. And on comparing with the industry, we found that the the average industry ROE is similar at 17%. Consequently, this likely laid the ground for the impressive net income growth of 43% seen over the past five years by Step One Clothing. However, there could also be other drivers behind this growth. For example, it is possible that the company's management has made some good strategic decisions, or that the company has a low payout ratio.
We then compared Step One Clothing's net income growth with the industry and we're pleased to see that the company's growth figure is higher when compared with the industry which has a growth rate of 18% in the same 5-year period.
Earnings growth is an important metric to consider when valuing a stock. The investor should try to establish if the expected growth or decline in earnings, whichever the case may be, is priced in. Doing so will help them establish if the stock's future looks promising or ominous. If you're wondering about Step One Clothing's's valuation, check out this gauge of its price-to-earnings ratio, as compared to its industry.
Is Step One Clothing Using Its Retained Earnings Effectively?
Step One Clothing's very high three-year median payout ratio of 136% suggests that the company is paying more to its shareholders than what it is earning. In spite of this, the company was able to grow its earnings significantly, as we saw above. Having said that, the high payout ratio is definitely risky and something to keep an eye on. Our risks dashboard should have the 2 risks we have identified for Step One Clothing.
While Step One Clothing has been growing its earnings, it only recently started to pay dividends which likely means that the company decided to impress new and existing shareholders with a dividend. Our latest analyst data shows that the future payout ratio of the company is expected to drop to 100% over the next three years. As a result, the expected drop in Step One Clothing's payout ratio explains the anticipated rise in the company's future ROE to 23%, over the same period.
Summary
In total, it does look like Step One Clothing has some positive aspects to its business. Specifically, its high ROE which likely led to the growth in earnings. Bear in mind, the company reinvests little to none of its profits, which means that investors aren't necessarily reaping the full benefits of the high rate of return. With that said, the latest industry analyst forecasts reveal that the company's earnings growth is expected to slow down. Are these analysts expectations based on the broad expectations for the industry, or on the company's fundamentals? Click here to be taken to our analyst's forecasts page for the company.
Have feedback on this article? Concerned about the content? Get in touch with us directly. Alternatively, email editorial-team (at) simplywallst.com.
This article by Simply Wall St is general in nature. We provide commentary based on historical data and analyst forecasts only using an unbiased methodology and our articles are not intended to be financial advice. It does not constitute a recommendation to buy or sell any stock, and does not take account of your objectives, or your financial situation. We aim to bring you long-term focused analysis driven by fundamental data. Note that our analysis may not factor in the latest price-sensitive company announcements or qualitative material. Simply Wall St has no position in any stocks mentioned.
