
 Yahoo Finance
 Fidelity National Financial (NYSE:FNF) shareholders have endured a 9.3% loss from investing in the stock a year ago
It's normal to be annoyed when stock you own has a declining share price. But sometimes a share price fall can have more to do with market conditions than the performance of the specific business. So while the Fidelity National Financial, Inc. (NYSE:FNF) share price is down 12% in the last year, the total return to shareholders (which includes dividends) was -9.3%. And that total return actually beats the market decline of 9.4%. On the other hand, the stock is actually up 3.7% over three years. In the last ninety days we've seen the share price slide 16%. But this could be related to the weak market, which is down 13% in the same period.
Since shareholders are down over the longer term, lets look at the underlying fundamentals over the that time and see if they've been consistent with returns.
View our latest analysis for Fidelity National Financial
While markets are a powerful pricing mechanism, share prices reflect investor sentiment, not just underlying business performance. One imperfect but simple way to consider how the market perception of a company has shifted is to compare the change in the earnings per share (EPS) with the share price movement.
Even though the Fidelity National Financial share price is down over the year, its EPS actually improved. Of course, the situation might betray previous over-optimism about growth.
The divergence between the EPS and the share price is quite notable, during the year. So it's easy to justify a look at some other metrics.
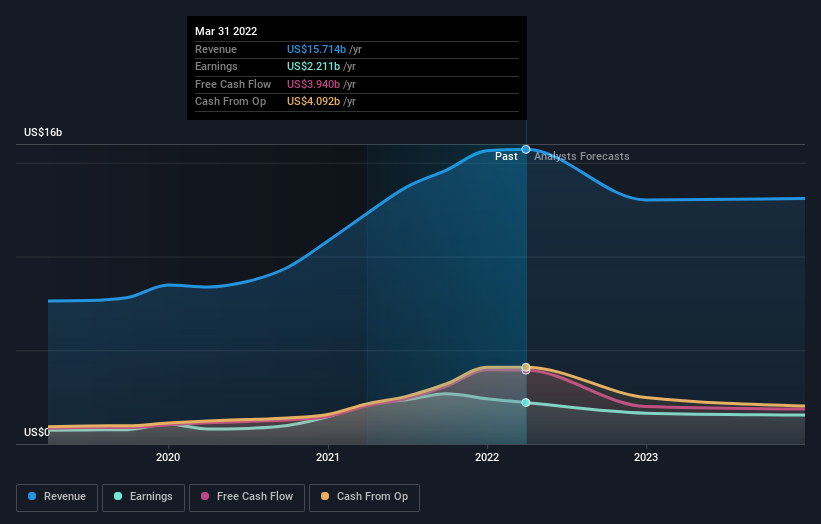
We don't see any weakness in the Fidelity National Financial's dividend so the steady payout can't really explain the share price drop. From what we can see, revenue is pretty flat, so that doesn't really explain the share price drop. Of course, it could simply be that it simply fell short of the market consensus expectations.
You can see below how earnings and revenue have changed over time (discover the exact values by clicking on the image).
It's probably worth noting that the CEO is paid less than the median at similar sized companies. It's always worth keeping an eye on CEO pay, but a more important question is whether the company will grow earnings throughout the years. You can see what analysts are predicting for Fidelity National Financial in this interactive graph of future profit estimates.
What About Dividends?
When looking at investment returns, it is important to consider the difference between total shareholder return (TSR) and share price return. The TSR is a return calculation that accounts for the value of cash dividends (assuming that any dividend received was reinvested) and the calculated value of any discounted capital raisings and spin-offs. Arguably, the TSR gives a more comprehensive picture of the return generated by a stock. In the case of Fidelity National Financial, it has a TSR of -9.3% for the last 1 year. That exceeds its share price return that we previously mentioned. The dividends paid by the company have thusly boosted the total shareholder return.
A Different Perspective
The total return of 9.3% received by Fidelity National Financial shareholders over the last year isn't far from the market return of -9.4%. Longer term investors wouldn't be so upset, since they would have made 10%, each year, over five years. If the fundamental data remains strong, and the share price is simply down on sentiment, then this could be an opportunity worth investigating. While it is well worth considering the different impacts that market conditions can have on the share price, there are other factors that are even more important. Even so, be aware that Fidelity National Financial is showing 2 warning signs in our investment analysis , and 1 of those doesn't sit too well with us...
If you are like me, then you will not want to miss this free list of growing companies that insiders are buying.
Please note, the market returns quoted in this article reflect the market weighted average returns of stocks that currently trade on US exchanges.
Have feedback on this article? Concerned about the content? Get in touch with us directly. Alternatively, email editorial-team (at) simplywallst.com.
This article by Simply Wall St is general in nature. We provide commentary based on historical data and analyst forecasts only using an unbiased methodology and our articles are not intended to be financial advice. It does not constitute a recommendation to buy or sell any stock, and does not take account of your objectives, or your financial situation. We aim to bring you long-term focused analysis driven by fundamental data. Note that our analysis may not factor in the latest price-sensitive company announcements or qualitative material. Simply Wall St has no position in any stocks mentioned.
