
 Yahoo Finance
 Fenix Resources' (ASX:FEX) investors will be pleased with their fantastic 936% return over the last three years
Fenix Resources Limited (ASX:FEX) shareholders might be concerned after seeing the share price drop 19% in the last quarter. But that doesn't change the fact that the returns over the last three years have been spectacular. Indeed, the share price is up a whopping 752% in that time. Arguably, the recent fall is to be expected after such a strong rise. The only way to form a view of whether the current price is justified is to consider the merits of the business itself. It really delights us to see such great share price performance for investors.
So let's assess the underlying fundamentals over the last 3 years and see if they've moved in lock-step with shareholder returns.
See our latest analysis for Fenix Resources
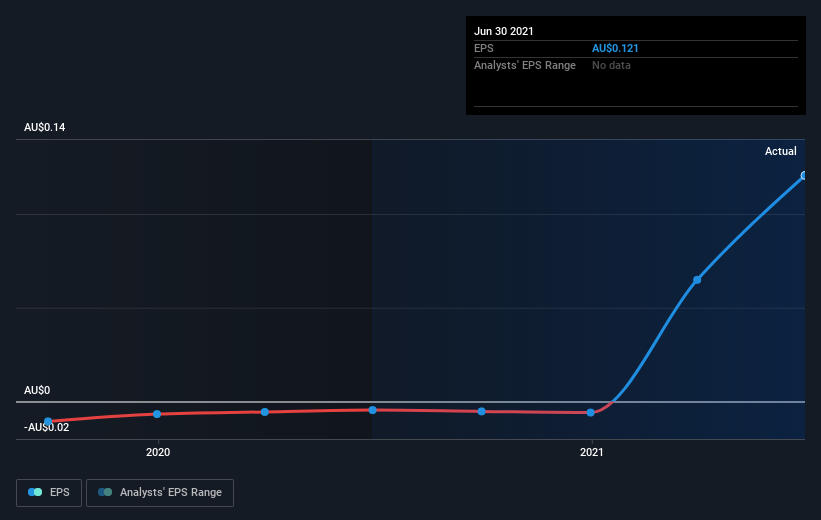
To quote Buffett, 'Ships will sail around the world but the Flat Earth Society will flourish. There will continue to be wide discrepancies between price and value in the marketplace...' One way to examine how market sentiment has changed over time is to look at the interaction between a company's share price and its earnings per share (EPS).
Fenix Resources became profitable within the last three years. Given the importance of this milestone, it's not overly surprising that the share price has increased strongly.
You can see below how EPS has changed over time (discover the exact values by clicking on the image).
Dive deeper into Fenix Resources' key metrics by checking this interactive graph of Fenix Resources's earnings, revenue and cash flow.
What About Dividends?
It is important to consider the total shareholder return, as well as the share price return, for any given stock. The TSR incorporates the value of any spin-offs or discounted capital raisings, along with any dividends, based on the assumption that the dividends are reinvested. Arguably, the TSR gives a more comprehensive picture of the return generated by a stock. In the case of Fenix Resources, it has a TSR of 936% for the last 3 years. That exceeds its share price return that we previously mentioned. This is largely a result of its dividend payments!
A Different Perspective
Fenix Resources shareholders are up 5.6% for the year (even including dividends). Unfortunately this falls short of the market return. It's probably a good sign that the company has an even better long term track record, having provided shareholders with an annual TSR of 44% over five years. It's quite possible the business continues to execute with prowess, even as the share price gains are slowing. It's always interesting to track share price performance over the longer term. But to understand Fenix Resources better, we need to consider many other factors. Consider risks, for instance. Every company has them, and we've spotted 5 warning signs for Fenix Resources you should know about.
Of course Fenix Resources may not be the best stock to buy. So you may wish to see this free collection of growth stocks.
Please note, the market returns quoted in this article reflect the market weighted average returns of stocks that currently trade on AU exchanges.
Have feedback on this article? Concerned about the content? Get in touch with us directly. Alternatively, email editorial-team (at) simplywallst.com.
This article by Simply Wall St is general in nature. We provide commentary based on historical data and analyst forecasts only using an unbiased methodology and our articles are not intended to be financial advice. It does not constitute a recommendation to buy or sell any stock, and does not take account of your objectives, or your financial situation. We aim to bring you long-term focused analysis driven by fundamental data. Note that our analysis may not factor in the latest price-sensitive company announcements or qualitative material. Simply Wall St has no position in any stocks mentioned.
