
 Yahoo Finance
 Exxon Mobil Corporation's (NYSE:XOM) Stock Has Seen Strong Momentum: Does That Call For Deeper Study Of Its Financial Prospects?
Exxon Mobil (NYSE:XOM) has had a great run on the share market with its stock up by a significant 15% over the last three months. Given that stock prices are usually aligned with a company's financial performance in the long-term, we decided to study its financial indicators more closely to see if they had a hand to play in the recent price move. In this article, we decided to focus on Exxon Mobil's ROE.
Return on equity or ROE is an important factor to be considered by a shareholder because it tells them how effectively their capital is being reinvested. Put another way, it reveals the company's success at turning shareholder investments into profits.
See our latest analysis for Exxon Mobil
How Is ROE Calculated?
Return on equity can be calculated by using the formula:
Return on Equity = Net Profit (from continuing operations) ÷ Shareholders' Equity
So, based on the above formula, the ROE for Exxon Mobil is:
22% = US$40b ÷ US$185b (Based on the trailing twelve months to June 2022).
The 'return' is the yearly profit. So, this means that for every $1 of its shareholder's investments, the company generates a profit of $0.22.
What Has ROE Got To Do With Earnings Growth?
We have already established that ROE serves as an efficient profit-generating gauge for a company's future earnings. Depending on how much of these profits the company reinvests or "retains", and how effectively it does so, we are then able to assess a company’s earnings growth potential. Assuming everything else remains unchanged, the higher the ROE and profit retention, the higher the growth rate of a company compared to companies that don't necessarily bear these characteristics.
A Side By Side comparison of Exxon Mobil's Earnings Growth And 22% ROE
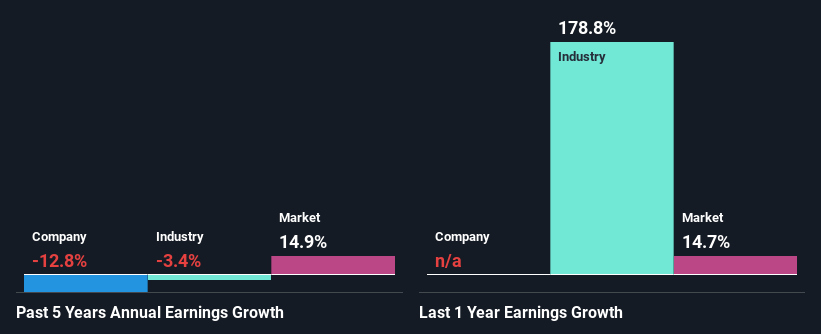
At first glance, Exxon Mobil seems to have a decent ROE. Even when compared to the industry average of 26% the company's ROE looks quite decent. However, while Exxon Mobil has a pretty respectable ROE, its five year net income decline rate was 13% . Based on this, we feel that there might be other reasons which haven't been discussed so far in this article that could be hampering the company's growth. For example, it could be that the company has a high payout ratio or the business has allocated capital poorly, for instance.
Next, when we compared with the industry, which has shrunk its earnings at a rate of 3.4% in the same period, we still found Exxon Mobil's performance to be quite bleak, because the company has been shrinking its earnings faster than the industry.
Earnings growth is a huge factor in stock valuation. It’s important for an investor to know whether the market has priced in the company's expected earnings growth (or decline). By doing so, they will have an idea if the stock is headed into clear blue waters or if swampy waters await. Has the market priced in the future outlook for XOM? You can find out in our latest intrinsic value infographic research report.
Is Exxon Mobil Efficiently Re-investing Its Profits?
Exxon Mobil has a high three-year median payout ratio of 65% (that is, it is retaining 35% of its profits). This suggests that the company is paying most of its profits as dividends to its shareholders. This goes some way in explaining why its earnings have been shrinking. The business is only left with a small pool of capital to reinvest - A vicious cycle that doesn't benefit the company in the long-run. You can see the 2 risks we have identified for Exxon Mobil by visiting our risks dashboard for free on our platform here.
Moreover, Exxon Mobil has been paying dividends for at least ten years or more suggesting that management must have perceived that the shareholders prefer dividends over earnings growth. Our latest analyst data shows that the future payout ratio of the company is expected to drop to 48% over the next three years. Still forecasts suggest that Exxon Mobil's future ROE will drop to 14% even though the the company's payout ratio is expected to decrease. This suggests that there could be other factors could driving the anticipated decline in the company's ROE.
Conclusion
On the whole, we do feel that Exxon Mobil has some positive attributes. Yet, the low earnings growth is a bit concerning, especially given that the company has a high rate of return. Investors could have benefitted from the high ROE, had the company been reinvesting more of its earnings. As discussed earlier, the company is retaining a small portion of its profits. In addition, on studying the latest analyst forecasts, we found that the company's earnings are expected to continue to shrink. To know more about the latest analysts predictions for the company, check out this visualization of analyst forecasts for the company.
Have feedback on this article? Concerned about the content? Get in touch with us directly. Alternatively, email editorial-team (at) simplywallst.com.
This article by Simply Wall St is general in nature. We provide commentary based on historical data and analyst forecasts only using an unbiased methodology and our articles are not intended to be financial advice. It does not constitute a recommendation to buy or sell any stock, and does not take account of your objectives, or your financial situation. We aim to bring you long-term focused analysis driven by fundamental data. Note that our analysis may not factor in the latest price-sensitive company announcements or qualitative material. Simply Wall St has no position in any stocks mentioned.
Join A Paid User Research Session
You’ll receive a US$30 Amazon Gift card for 1 hour of your time while helping us build better investing tools for the individual investors like yourself. Sign up here
