
 Yahoo Finance
 Exploring Top Dividend Stocks In India For March 2024
Amidst a backdrop of broad-based profit booking and valuation concerns, Indian blue-chip shares have experienced a notable decline, with the NSE Nifty 50 and BSE Sensex both shedding value in recent trading sessions. In these fluctuating market conditions, investors often look towards dividend stocks as a potential source of steady income and relative stability.
Top 10 Dividend Stocks In India
Name | Dividend Yield | Dividend Rating |
EPL (BSE:500135) | 2.29% | ★★★★★★ |
Narmada Gelatines (BSE:526739) | 2.74% | ★★★★★★ |
Vinyl Chemicals (India) (BSE:524129) | 2.93% | ★★★★★★ |
Castrol India (BSE:500870) | 3.74% | ★★★★★☆ |
Karnataka Bank (NSEI:KTKBANK) | 2.22% | ★★★★★☆ |
Balmer Lawrie (BSE:523319) | 3.45% | ★★★★★☆ |
Indian Oil (NSEI:IOC) | 3.11% | ★★★★★☆ |
PTC India (NSEI:PTC) | 4.45% | ★★★★★☆ |
Ruchira Papers (NSEI:RUCHIRA) | 4.23% | ★★★★★☆ |
Bank of Baroda (NSEI:BANKBARODA) | 2.16% | ★★★★★☆ |
Click here to see the full list of 70 stocks from our Top Dividend Stocks screener.
Below we spotlight a couple of our favorites from our exclusive screener.
ITC (NSEI:ITC)
Simply Wall St Dividend Rating: ★★★★★☆
Overview: ITC Limited is a diversified conglomerate with operations in fast-moving consumer goods, hospitality, paperboards and paper, packaging, agriculture, and information technology sectors in India and globally, boasting a market cap of approximately ₹5.21 trillion.
Operations: ITC Limited's revenue is primarily derived from its FMCG - Cigarettes segment at ₹330.61 billion, followed by FMCG - Others at ₹206.45 billion, Agri Business at ₹165.95 billion, and Paperboards, Paper & Packaging at ₹84.93 billion, with a smaller contribution from the Hotels division generating ₹29.81 billion.
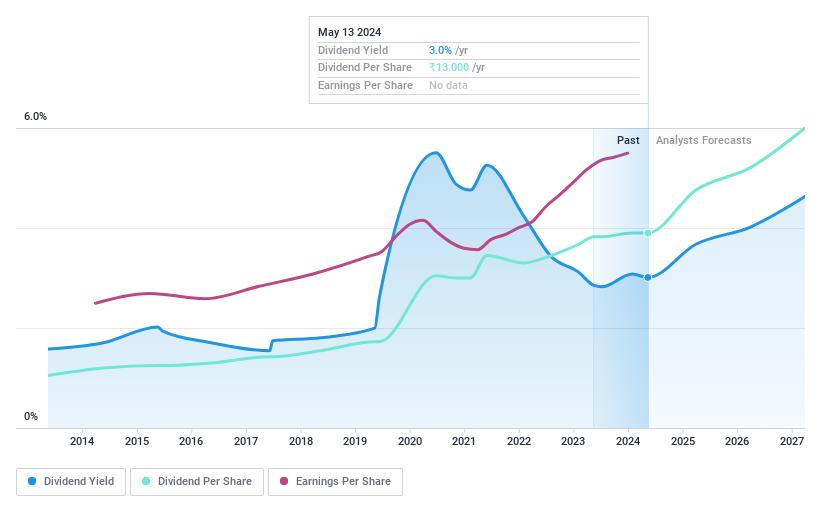
Dividend Yield: 3.1%
ITC Limited, a diversified conglomerate, has been a consistent dividend payer with a recent interim dividend declared at INR 6.25 per share. Despite stable dividends over the past decade and earnings growth of 9.7% annually over five years, the payout ratio suggests dividends are not well covered by earnings or cash flows. The government's decision not to divest its stake may provide stability, while British American Tobacco's partial stake sale could impact ITC's stock dynamics. ITC trades below analyst price targets with potential for price appreciation; however, its high cash payout ratio of 103.7% raises questions about the sustainability of future dividends without adequate cash flow coverage.
Akzo Nobel India (BSE:500710)
Simply Wall St Dividend Rating: ★★★★★☆
Overview: Akzo Nobel India Limited is a company engaged in the manufacturing, distribution, and sale of paints and coatings within India and across global markets, with a market capitalization of approximately ₹112.85 billion.
Operations: Akzo Nobel India Limited generates its revenue primarily from the coatings segment, which amounted to ₹39.40 billion.
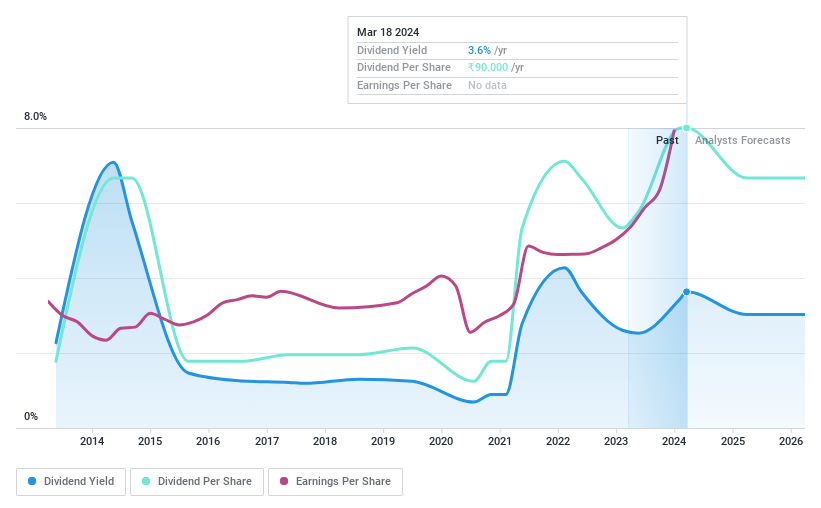
Dividend Yield: 3.6%
Akzo Nobel India's dividend yield stands at a robust 3.63%, outshining the Indian market average. The company's recent earnings report showed a substantial year-over-year growth of 31.5%, with revenues forecasted to climb by 11.44% annually, signaling potential for continued financial health. Though dividends have experienced volatility over the past decade, current earnings and cash flows—with payout ratios of 82.6% and cash payout ratio at 78.6% respectively—provide coverage for existing payouts, presenting a balanced view on sustainability despite an unstable dividend track record. The Price-To-Earnings ratio sits below the market average at 27.3x, hinting at relative value in pricing amidst recent regulatory challenges resolved under amnesty provisions, further reinforcing its standing among dividend stocks in India.
HCL Technologies (NSEI:HCLTECH)
Simply Wall St Dividend Rating: ★★★★★☆
Overview: HCL Technologies Limited is a global enterprise providing software development, business process outsourcing, and infrastructure management services with a market capitalization of approximately ₹4.45 trillion.
Operations: HCL Technologies Limited generates its revenue primarily through three segments: IT and Business Services at $9.63 billion, Engineering and R&D Services at $2.09 billion, and HCL Software at $1.41 billion.
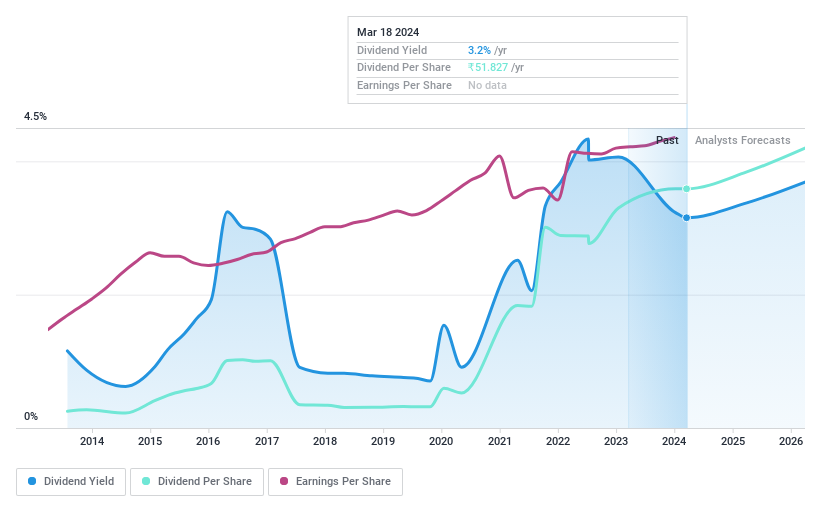
Dividend Yield: 3.2%
HCL Technologies, with a recent interim dividend declaration of ₹12 per share, maintains a commitment to shareholder returns. The company's strategic advances in AI through partnerships and product launches like HCLTech AI Force and FlexSpace 5G underline its focus on innovation-led growth. Despite an earnings increase of 6% over five years, the payout ratio at 86.5% and cash payout ratio at 66% suggest dividends are well-supported by both profits and cash flows. However, historical volatility in dividend payments raises questions about long-term reliability amidst competitive industry dynamics.
Get an in-depth perspective on HCL Technologies' performance by reading our dividend report here.
Our valuation report here indicates HCL Technologies may be undervalued.
Where To Now?
Access the full spectrum of 70 Top Dividend Stocks by clicking on this link.
Got skin in the game with these stocks? Elevate how you manage them by using Simply Wall St's portfolio, where intuitive tools await to help optimize your investment outcomes.
Join a community of smart investors by using Simply Wall St. It's free and delivers expert-level analysis on worldwide markets.
Contemplating Other Strategies?
Explore small companies with big growth potential before they take off.
Fuel your portfolio with fast-growing stocks poised for rapid expansion.
Play it safe and steady with these reliable blue chips that offer both stability and growth.
This article by Simply Wall St is general in nature. We provide commentary based on historical data and analyst forecasts only using an unbiased methodology and our articles are not intended to be financial advice. It does not constitute a recommendation to buy or sell any stock, and does not take account of your objectives, or your financial situation. We aim to bring you long-term focused analysis driven by fundamental data. Note that our analysis may not factor in the latest price-sensitive company announcements or qualitative material. Simply Wall St has no position in any stocks mentioned.
Have feedback on this article? Concerned about the content? Get in touch with us directly. Alternatively, email editorial-team@simplywallst.com
