
 Yahoo Finance
 Experience Co Limited (ASX:EXP): Time For A Financial Health Check

Want to participate in a short research study? Help shape the future of investing tools and receive a $20 prize!
Experience Co Limited (ASX:EXP) is a small-cap stock with a market capitalization of AU$133m. While investors primarily focus on the growth potential and competitive landscape of the small-cap companies, they end up ignoring a key aspect, which could be the biggest threat to its existence: its financial health. Why is it important? Assessing first and foremost the financial health is crucial, as mismanagement of capital can lead to bankruptcies, which occur at a higher rate for small-caps. Here are a few basic checks that are good enough to have a broad overview of the company’s financial strength. Though, I know these factors are very high-level, so I’d encourage you to dig deeper yourself into EXP here.
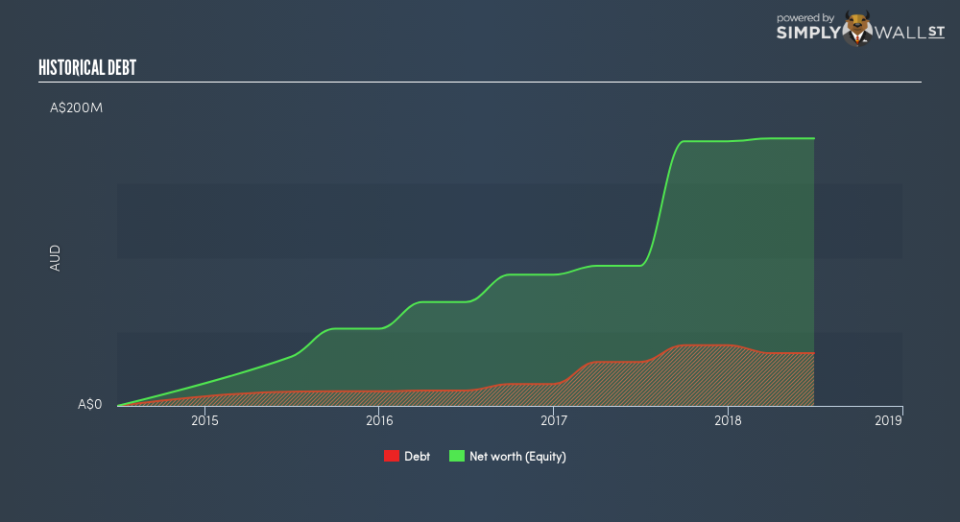
Does EXP produce enough cash relative to debt?
EXP has built up its total debt levels in the last twelve months, from AU$30m to AU$36m , which includes long-term debt. With this rise in debt, the current cash and short-term investment levels stands at AU$7.2m , ready to deploy into the business. On top of this, EXP has produced cash from operations of AU$15m in the last twelve months, resulting in an operating cash to total debt ratio of 42%, signalling that EXP’s operating cash is sufficient to cover its debt. This ratio can also be a sign of operational efficiency as an alternative to return on assets. In EXP’s case, it is able to generate 0.42x cash from its debt capital.
Can EXP pay its short-term liabilities?
At the current liabilities level of AU$17m, it seems that the business has been able to meet these commitments with a current assets level of AU$23m, leading to a 1.33x current account ratio. Generally, for Hospitality companies, this is a reasonable ratio as there’s enough of a cash buffer without holding too much capital in low return investments.
Can EXP service its debt comfortably?
With debt at 20% of equity, EXP may be thought of as appropriately levered. This range is considered safe as EXP is not taking on too much debt obligation, which can be restrictive and risky for equity-holders. We can check to see whether EXP is able to meet its debt obligations by looking at the net interest coverage ratio. A company generating earnings before interest and tax (EBIT) at least three times its net interest payments is considered financially sound. In EXP’s, case, the ratio of 7.98x suggests that interest is appropriately covered, which means that debtors may be willing to loan the company more money, giving EXP ample headroom to grow its debt facilities.
Next Steps:
EXP’s high cash coverage and low debt levels indicate its ability to utilise its borrowings efficiently in order to generate ample cash flow. Furthermore, the company exhibits proper management of current assets and upcoming liabilities. Keep in mind I haven’t considered other factors such as how EXP has been performing in the past. I recommend you continue to research Experience Co to get a better picture of the stock by looking at:
Future Outlook: What are well-informed industry analysts predicting for EXP’s future growth? Take a look at our free research report of analyst consensus for EXP’s outlook.
Historical Performance: What has EXP’s returns been like over the past? Go into more detail in the past track record analysis and take a look at the free visual representations of our analysis for more clarity.
Other High-Performing Stocks: Are there other stocks that provide better prospects with proven track records? Explore our free list of these great stocks here.
We aim to bring you long-term focused research analysis driven by fundamental data. Note that our analysis may not factor in the latest price-sensitive company announcements or qualitative material.
If you spot an error that warrants correction, please contact the editor at editorial-team@simplywallst.com. This article by Simply Wall St is general in nature. It does not constitute a recommendation to buy or sell any stock, and does not take account of your objectives, or your financial situation. Simply Wall St has no position in the stocks mentioned. Thank you for reading.
