
 Yahoo Finance
 Is Experience Co Limited’s (ASX:EXP) High P/E Ratio A Problem For Investors?

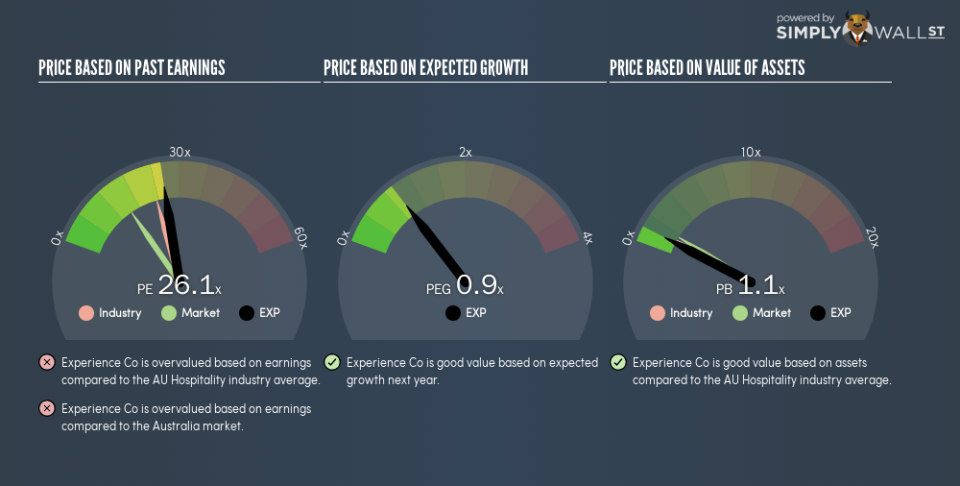
The goal of this article is to teach you how to use price to earnings ratios (P/E ratios). We’ll show how you can use Experience Co Limited’s (ASX:EXP) P/E ratio to inform your assessment of the investment opportunity. Experience Co has a price to earnings ratio of 26.1, based on the last twelve months. That means that at current prices, buyers pay A$26.1 for every A$1 in trailing yearly profits.
View our latest analysis for Experience Co
How Do I Calculate A Price To Earnings Ratio?
The formula for P/E is:
Price to Earnings Ratio = Share Price ÷ Earnings per Share (EPS)
Or for Experience Co:
P/E of 26.1 = A$0.35 ÷ A$0.013 (Based on the trailing twelve months to June 2018.)
Is A High Price-to-Earnings Ratio Good?
A higher P/E ratio means that investors are paying a higher price for each A$1 of company earnings. All else being equal, it’s better to pay a low price — but as Warren Buffett said, ‘It’s far better to buy a wonderful company at a fair price than a fair company at a wonderful price.’
How Growth Rates Impact P/E Ratios
Probably the most important factor in determining what P/E a company trades on is the earnings growth. When earnings grow, the ‘E’ increases, over time. That means unless the share price increases, the P/E will reduce in a few years. So while a stock may look expensive based on past earnings, it could be cheap based on future earnings.
Experience Co’s earnings per share fell by 40% in the last twelve months. But EPS is up 12% over the last 3 years.
How Does Experience Co’s P/E Ratio Compare To Its Peers?
The P/E ratio indicates whether the market has higher or lower expectations of a company. As you can see below, Experience Co has a higher P/E than the average company (22.6) in the hospitality industry.
That means that the market expects Experience Co will outperform other companies in its industry. The market is optimistic about the future, but that doesn’t guarantee future growth. So further research is always essential. I often monitor director buying and selling.
Don’t Forget: The P/E Does Not Account For Debt or Bank Deposits
It’s important to note that the P/E ratio considers the market capitalization, not the enterprise value. That means it doesn’t take debt or cash into account. Hypothetically, a company could reduce its future P/E ratio by spending its cash (or taking on debt) to achieve higher earnings.
Such expenditure might be good or bad, in the long term, but the point here is that the balance sheet is not reflected by this ratio.
Is Debt Impacting Experience Co’s P/E?
Experience Co has net debt worth 15% of its market capitalization. That’s enough debt to impact the P/E ratio a little; so keep it in mind if you’re comparing it to companies without debt.
The Bottom Line On Experience Co’s P/E Ratio
Experience Co has a P/E of 26.1. That’s higher than the average in the AU market, which is 15.2. With modest debt but no EPS growth in the last year, it’s fair to say the P/E implies some optimism about future earnings, from the market.
Investors have an opportunity when market expectations about a stock are wrong. People often underestimate remarkable growth — so investors can make money when fast growth is not fully appreciated. So this free visualization of the analyst consensus on future earnings could help you make the right decision about whether to buy, sell, or hold.
But note: Experience Co may not be the best stock to buy. So take a peek at this free list of interesting companies with strong recent earnings growth (and a P/E ratio below 20).
To help readers see past the short term volatility of the financial market, we aim to bring you a long-term focused research analysis purely driven by fundamental data. Note that our analysis does not factor in the latest price-sensitive company announcements.
The author is an independent contributor and at the time of publication had no position in the stocks mentioned. For errors that warrant correction please contact the editor at editorial-team@simplywallst.com.
