
 Yahoo Finance
 Is Experian plc's (LON:EXPN) High P/E Ratio A Problem For Investors?

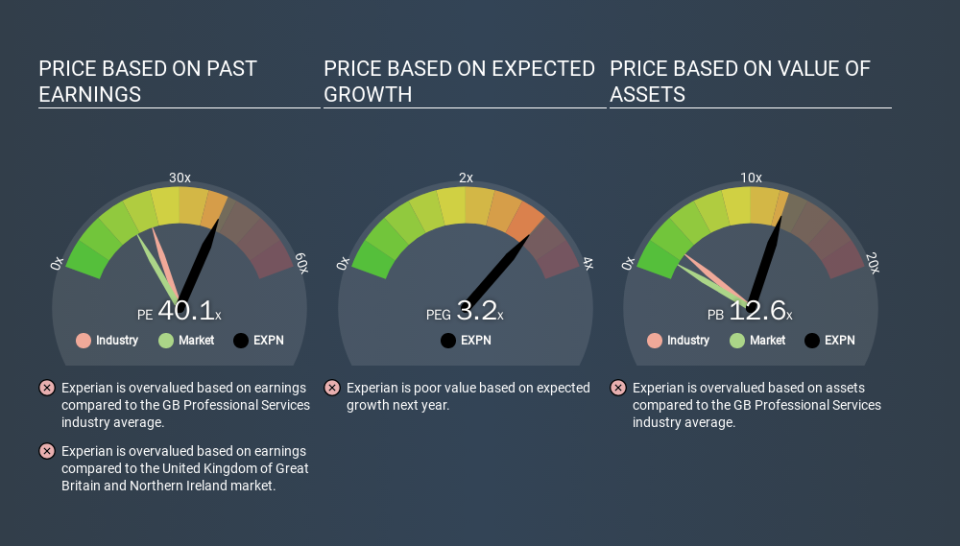
The goal of this article is to teach you how to use price to earnings ratios (P/E ratios). We'll look at Experian plc's (LON:EXPN) P/E ratio and reflect on what it tells us about the company's share price. Experian has a P/E ratio of 40.12, based on the last twelve months. In other words, at today's prices, investors are paying £40.12 for every £1 in prior year profit.
Check out our latest analysis for Experian
How Do You Calculate Experian's P/E Ratio?
The formula for price to earnings is:
Price to Earnings Ratio = Price per Share (in the reporting currency) ÷ Earnings per Share (EPS)
Or for Experian:
P/E of 40.12 = £32.34 (Note: this is the share price in the reporting currency, namely, USD ) ÷ £0.81 (Based on the trailing twelve months to September 2019.)
Is A High Price-to-Earnings Ratio Good?
The higher the P/E ratio, the higher the price tag of a business, relative to its trailing earnings. That isn't a good or a bad thing on its own, but a high P/E means that buyers have a higher opinion of the business's prospects, relative to stocks with a lower P/E.
How Does Experian's P/E Ratio Compare To Its Peers?
We can get an indication of market expectations by looking at the P/E ratio. You can see in the image below that the average P/E (22.4) for companies in the professional services industry is lower than Experian's P/E.
Its relatively high P/E ratio indicates that Experian shareholders think it will perform better than other companies in its industry classification. The market is optimistic about the future, but that doesn't guarantee future growth. So further research is always essential. I often monitor director buying and selling.
How Growth Rates Impact P/E Ratios
If earnings fall then in the future the 'E' will be lower. That means even if the current P/E is low, it will increase over time if the share price stays flat. So while a stock may look cheap based on past earnings, it could be expensive based on future earnings.
Experian shrunk earnings per share by 4.5% last year. And it has shrunk its earnings per share by 1.0% per year over the last three years. This growth rate might warrant a low P/E ratio. So you wouldn't expect a very high P/E.
Remember: P/E Ratios Don't Consider The Balance Sheet
The 'Price' in P/E reflects the market capitalization of the company. In other words, it does not consider any debt or cash that the company may have on the balance sheet. The exact same company would hypothetically deserve a higher P/E ratio if it had a strong balance sheet, than if it had a weak one with lots of debt, because a cashed up company can spend on growth.
Such expenditure might be good or bad, in the long term, but the point here is that the balance sheet is not reflected by this ratio.
How Does Experian's Debt Impact Its P/E Ratio?
Net debt totals 14% of Experian's market cap. That's enough debt to impact the P/E ratio a little; so keep it in mind if you're comparing it to companies without debt.
The Bottom Line On Experian's P/E Ratio
Experian's P/E is 40.1 which is above average (17.2) in its market. With a bit of debt, but a lack of recent growth, it's safe to say the market is expecting improved profit performance from the company, in the next few years.
Investors should be looking to buy stocks that the market is wrong about. If the reality for a company is better than it expects, you can make money by buying and holding for the long term. So this free visual report on analyst forecasts could hold the key to an excellent investment decision.
But note: Experian may not be the best stock to buy. So take a peek at this free list of interesting companies with strong recent earnings growth (and a P/E ratio below 20).
If you spot an error that warrants correction, please contact the editor at editorial-team@simplywallst.com. This article by Simply Wall St is general in nature. It does not constitute a recommendation to buy or sell any stock, and does not take account of your objectives, or your financial situation. Simply Wall St has no position in the stocks mentioned.
We aim to bring you long-term focused research analysis driven by fundamental data. Note that our analysis may not factor in the latest price-sensitive company announcements or qualitative material. Thank you for reading.
