
 Yahoo Finance
 Examining Chart Industries, Inc.’s (NASDAQ:GTLS) Weak Return On Capital Employed

Today we'll look at Chart Industries, Inc. (NASDAQ:GTLS) and reflect on its potential as an investment. Specifically, we'll consider its Return On Capital Employed (ROCE), since that will give us an insight into how efficiently the business can generate profits from the capital it requires.
First, we'll go over how we calculate ROCE. Then we'll compare its ROCE to similar companies. And finally, we'll look at how its current liabilities are impacting its ROCE.
What is Return On Capital Employed (ROCE)?
ROCE is a metric for evaluating how much pre-tax income (in percentage terms) a company earns on the capital invested in its business. All else being equal, a better business will have a higher ROCE. In brief, it is a useful tool, but it is not without drawbacks. Renowned investment researcher Michael Mauboussin has suggested that a high ROCE can indicate that 'one dollar invested in the company generates value of more than one dollar'.
How Do You Calculate Return On Capital Employed?
Analysts use this formula to calculate return on capital employed:
Return on Capital Employed = Earnings Before Interest and Tax (EBIT) ÷ (Total Assets - Current Liabilities)
Or for Chart Industries:
0.067 = US$109m ÷ (US$2.0b - US$355m) (Based on the trailing twelve months to June 2019.)
So, Chart Industries has an ROCE of 6.7%.
See our latest analysis for Chart Industries
Is Chart Industries's ROCE Good?
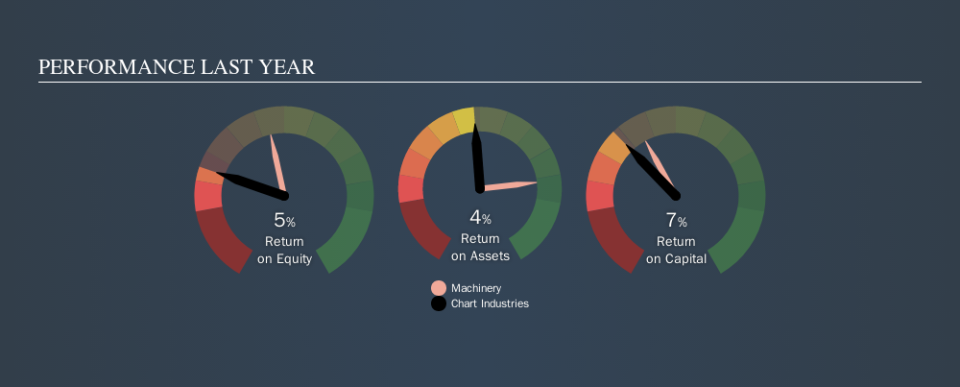
ROCE can be useful when making comparisons, such as between similar companies. We can see Chart Industries's ROCE is meaningfully below the Machinery industry average of 12%. This performance is not ideal, as it suggests the company may not be deploying its capital as effectively as some competitors. Aside from the industry comparison, Chart Industries's ROCE is mediocre in absolute terms, considering the risk of investing in stocks versus the safety of a bank account. Readers may find more attractive investment prospects elsewhere.
You can see in the image below how Chart Industries's ROCE compares to its industry. Click to see more on past growth.
When considering this metric, keep in mind that it is backwards looking, and not necessarily predictive. Companies in cyclical industries can be difficult to understand using ROCE, as returns typically look high during boom times, and low during busts. This is because ROCE only looks at one year, instead of considering returns across a whole cycle. Future performance is what matters, and you can see analyst predictions in our free report on analyst forecasts for the company.
Do Chart Industries's Current Liabilities Skew Its ROCE?
Current liabilities include invoices, such as supplier payments, short-term debt, or a tax bill, that need to be paid within 12 months. Due to the way ROCE is calculated, a high level of current liabilities makes a company look as though it has less capital employed, and thus can (sometimes unfairly) boost the ROCE. To check the impact of this, we calculate if a company has high current liabilities relative to its total assets.
Chart Industries has total liabilities of US$355m and total assets of US$2.0b. Therefore its current liabilities are equivalent to approximately 18% of its total assets. This is a modest level of current liabilities, which would only have a small effect on ROCE.
What We Can Learn From Chart Industries's ROCE
That said, Chart Industries's ROCE is mediocre, there may be more attractive investments around. Of course, you might find a fantastic investment by looking at a few good candidates. So take a peek at this free list of companies with modest (or no) debt, trading on a P/E below 20.
Chart Industries is not the only stock insiders are buying. So take a peek at this free list of growing companies with insider buying.
We aim to bring you long-term focused research analysis driven by fundamental data. Note that our analysis may not factor in the latest price-sensitive company announcements or qualitative material.
If you spot an error that warrants correction, please contact the editor at editorial-team@simplywallst.com. This article by Simply Wall St is general in nature. It does not constitute a recommendation to buy or sell any stock, and does not take account of your objectives, or your financial situation. Simply Wall St has no position in the stocks mentioned. Thank you for reading.
