
 Yahoo Finance
 Is Eversource Energy's (NYSE:ES) High P/E Ratio A Problem For Investors?

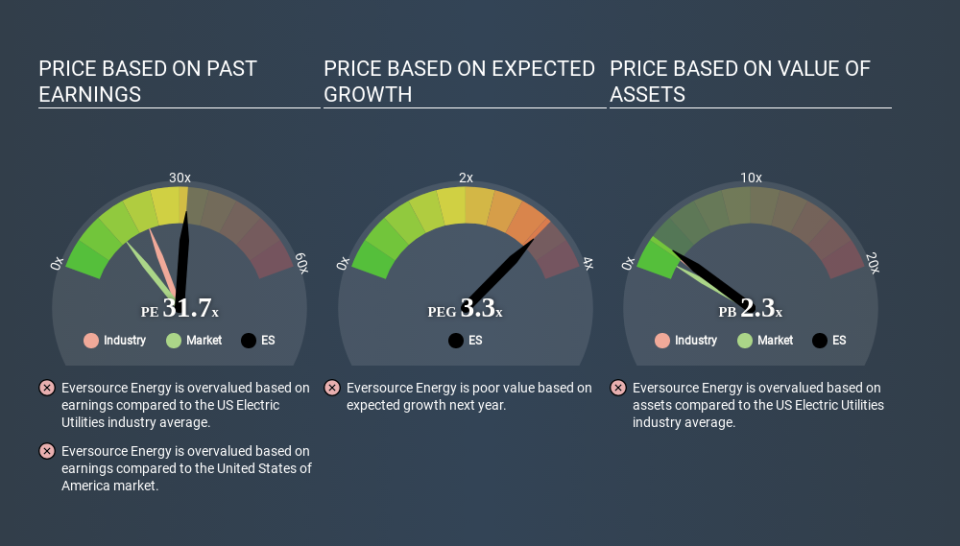
This article is for investors who would like to improve their understanding of price to earnings ratios (P/E ratios). We'll apply a basic P/E ratio analysis to Eversource Energy's (NYSE:ES), to help you decide if the stock is worth further research. Eversource Energy has a P/E ratio of 31.75, based on the last twelve months. That is equivalent to an earnings yield of about 3.1%.
See our latest analysis for Eversource Energy
How Do You Calculate Eversource Energy's P/E Ratio?
The formula for price to earnings is:
Price to Earnings Ratio = Share Price ÷ Earnings per Share (EPS)
Or for Eversource Energy:
P/E of 31.75 = $89.790 ÷ $2.828 (Based on the trailing twelve months to December 2019.)
(Note: the above calculation results may not be precise due to rounding.)
Is A High P/E Ratio Good?
A higher P/E ratio means that investors are paying a higher price for each $1 of company earnings. All else being equal, it's better to pay a low price -- but as Warren Buffett said, 'It's far better to buy a wonderful company at a fair price than a fair company at a wonderful price'.
How Does Eversource Energy's P/E Ratio Compare To Its Peers?
The P/E ratio indicates whether the market has higher or lower expectations of a company. As you can see below, Eversource Energy has a higher P/E than the average company (20.5) in the electric utilities industry.
That means that the market expects Eversource Energy will outperform other companies in its industry. The market is optimistic about the future, but that doesn't guarantee future growth. So investors should delve deeper. I like to check if company insiders have been buying or selling.
How Growth Rates Impact P/E Ratios
Companies that shrink earnings per share quickly will rapidly decrease the 'E' in the equation. That means unless the share price falls, the P/E will increase in a few years. Then, a higher P/E might scare off shareholders, pushing the share price down.
Eversource Energy shrunk earnings per share by 13% over the last year. But EPS is up 1.8% over the last 5 years. And over the longer term (3 years) earnings per share have decreased 1.6% annually. This could justify a low P/E.
Don't Forget: The P/E Does Not Account For Debt or Bank Deposits
The 'Price' in P/E reflects the market capitalization of the company. In other words, it does not consider any debt or cash that the company may have on the balance sheet. Theoretically, a business can improve its earnings (and produce a lower P/E in the future) by investing in growth. That means taking on debt (or spending its cash).
While growth expenditure doesn't always pay off, the point is that it is a good option to have; but one that the P/E ratio ignores.
Eversource Energy's Balance Sheet
Net debt totals 52% of Eversource Energy's market cap. This is enough debt that you'd have to make some adjustments before using the P/E ratio to compare it to a company with net cash.
The Verdict On Eversource Energy's P/E Ratio
Eversource Energy's P/E is 31.7 which is above average (13.2) in its market. With meaningful debt and a lack of recent earnings growth, the market has high expectations that the business will earn more in the future.
Investors should be looking to buy stocks that the market is wrong about. People often underestimate remarkable growth -- so investors can make money when fast growth is not fully appreciated. So this free visualization of the analyst consensus on future earnings could help you make the right decision about whether to buy, sell, or hold.
Of course you might be able to find a better stock than Eversource Energy. So you may wish to see this free collection of other companies that have grown earnings strongly.
If you spot an error that warrants correction, please contact the editor at editorial-team@simplywallst.com. This article by Simply Wall St is general in nature. It does not constitute a recommendation to buy or sell any stock, and does not take account of your objectives, or your financial situation. Simply Wall St has no position in the stocks mentioned.
We aim to bring you long-term focused research analysis driven by fundamental data. Note that our analysis may not factor in the latest price-sensitive company announcements or qualitative material. Thank you for reading.
