
 Yahoo Finance
 Everest Re Group (NYSE:RE) Shareholders Have Enjoyed A 56% Share Price Gain

Want to participate in a short research study? Help shape the future of investing tools and you could win a $250 gift card!
When we invest, we're generally looking for stocks that outperform the market average. Buying under-rated businesses is one path to excess returns. To wit, the Everest Re Group share price has climbed 56% in five years, easily topping the market return of 43% (ignoring dividends). However, more recent returns haven't been as impressive as that, with the stock returning just 15% in the last year, including dividends.
View our latest analysis for Everest Re Group
While markets are a powerful pricing mechanism, share prices reflect investor sentiment, not just underlying business performance. One way to examine how market sentiment has changed over time is to look at the interaction between a company's share price and its earnings per share (EPS).
Everest Re Group's earnings per share are down 25% per year, despite strong share price performance over five years. Essentially, it doesn't seem likely that investors are focused on EPS. Because earnings per share don't seem to match up with the share price, we'll take a look at other metrics instead.
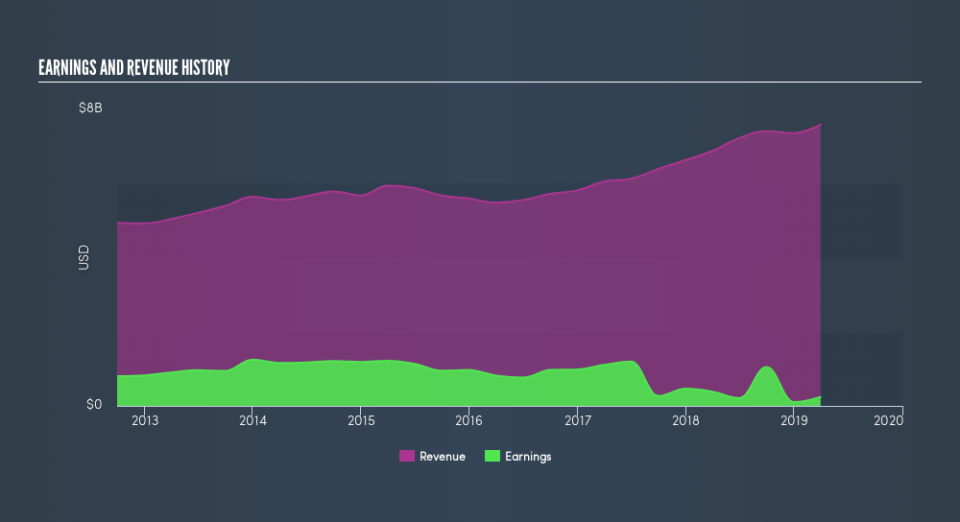
On the other hand, Everest Re Group's revenue is growing nicely, at a compound rate of 6.3% over the last five years. In that case, the company may be sacrificing current earnings per share to drive growth.
The company's revenue and earnings (over time) are depicted in the image below (click to see the exact numbers).
Balance sheet strength is crucual. It might be well worthwhile taking a look at our free report on how its financial position has changed over time.
What About Dividends?
It is important to consider the total shareholder return, as well as the share price return, for any given stock. Whereas the share price return only reflects the change in the share price, the TSR includes the value of dividends (assuming they were reinvested) and the benefit of any discounted capital raising or spin-off. It's fair to say that the TSR gives a more complete picture for stocks that pay a dividend. We note that for Everest Re Group the TSR over the last 5 years was 74%, which is better than the share price return mentioned above. The dividends paid by the company have thusly boosted the total shareholder return.
A Different Perspective
We're pleased to report that Everest Re Group shareholders have received a total shareholder return of 15% over one year. Of course, that includes the dividend. That's better than the annualised return of 12% over half a decade, implying that the company is doing better recently. Someone with an optimistic perspective could view the recent improvement in TSR as indicating that the business itself is getting better with time. Most investors take the time to check the data on insider transactions. You can click here to see if insiders have been buying or selling.
Of course Everest Re Group may not be the best stock to buy. So you may wish to see this free collection of growth stocks.
Please note, the market returns quoted in this article reflect the market weighted average returns of stocks that currently trade on US exchanges.
We aim to bring you long-term focused research analysis driven by fundamental data. Note that our analysis may not factor in the latest price-sensitive company announcements or qualitative material.
If you spot an error that warrants correction, please contact the editor at editorial-team@simplywallst.com. This article by Simply Wall St is general in nature. It does not constitute a recommendation to buy or sell any stock, and does not take account of your objectives, or your financial situation. Simply Wall St has no position in the stocks mentioned. Thank you for reading.
