
 Yahoo Finance
 Even though GoDaddy (NYSE:GDDY) has lost US$772m market cap in last 7 days, shareholders are still up 60% over 5 years
GoDaddy Inc. (NYSE:GDDY) shareholders might be concerned after seeing the share price drop 11% in the last quarter. But at least the stock is up over the last five years. Unfortunately its return of 60% is below the market return of 62%. While the long term returns are impressive, we do have some sympathy for those who bought more recently, given the 20% drop, in the last year.
In light of the stock dropping 6.6% in the past week, we want to investigate the longer term story, and see if fundamentals have been the driver of the company's positive five-year return.
View our latest analysis for GoDaddy
To quote Buffett, 'Ships will sail around the world but the Flat Earth Society will flourish. There will continue to be wide discrepancies between price and value in the marketplace...' One way to examine how market sentiment has changed over time is to look at the interaction between a company's share price and its earnings per share (EPS).
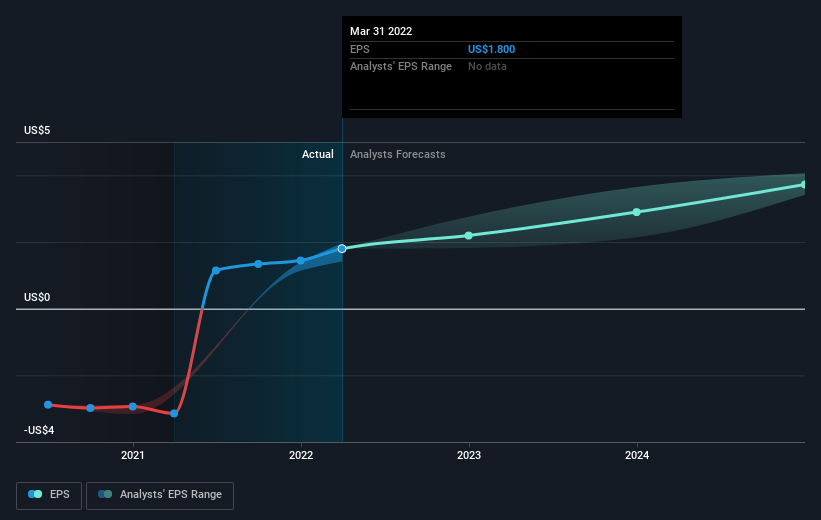
During the last half decade, GoDaddy became profitable. That's generally thought to be a genuine positive, so we would expect to see an increasing share price. Given that the company made a profit three years ago, but not five years ago, it is worth looking at the share price returns over the last three years, too. We can see that the GoDaddy share price is down 4.7% in the last three years. During the same period, EPS grew by 52% each year. So there seems to be a mismatch between the positive EPS growth and the change in the share price, which is down -1.6% per year.
The graphic below depicts how EPS has changed over time (unveil the exact values by clicking on the image).
It is of course excellent to see how GoDaddy has grown profits over the years, but the future is more important for shareholders. If you are thinking of buying or selling GoDaddy stock, you should check out this FREE detailed report on its balance sheet.
A Different Perspective
The total return of 20% received by GoDaddy shareholders over the last year isn't far from the market return of -20%. Longer term investors wouldn't be so upset, since they would have made 10%, each year, over five years. If the stock price has been impacted by changing sentiment, rather than deteriorating business conditions, it could spell opportunity. It's always interesting to track share price performance over the longer term. But to understand GoDaddy better, we need to consider many other factors. Case in point: We've spotted 4 warning signs for GoDaddy you should be aware of, and 1 of them doesn't sit too well with us.
If you are like me, then you will not want to miss this free list of growing companies that insiders are buying.
Please note, the market returns quoted in this article reflect the market weighted average returns of stocks that currently trade on US exchanges.
Have feedback on this article? Concerned about the content? Get in touch with us directly. Alternatively, email editorial-team (at) simplywallst.com.
This article by Simply Wall St is general in nature. We provide commentary based on historical data and analyst forecasts only using an unbiased methodology and our articles are not intended to be financial advice. It does not constitute a recommendation to buy or sell any stock, and does not take account of your objectives, or your financial situation. We aim to bring you long-term focused analysis driven by fundamental data. Note that our analysis may not factor in the latest price-sensitive company announcements or qualitative material. Simply Wall St has no position in any stocks mentioned.
