
 Yahoo Finance
 EUR/USD Mid-Session Technical Analysis for February 13, 2018
The EUR/USD is trading higher on Tuesday. The Forex pair is being driven by the momentum created by Friday’s closing price reversal bottom. The strong gains the last two days have put the market in a position to challenge a retracement zone. Trader reaction to this zone should set the tone of the EUR/USD for the rest of the week.
Daily Technical Analysis
The main trend is down according to the daily swing chart. However, momentum shifted to the upside with the formation of the closing price reversal bottom on February 9 and the subsequent confirmation on Monday.
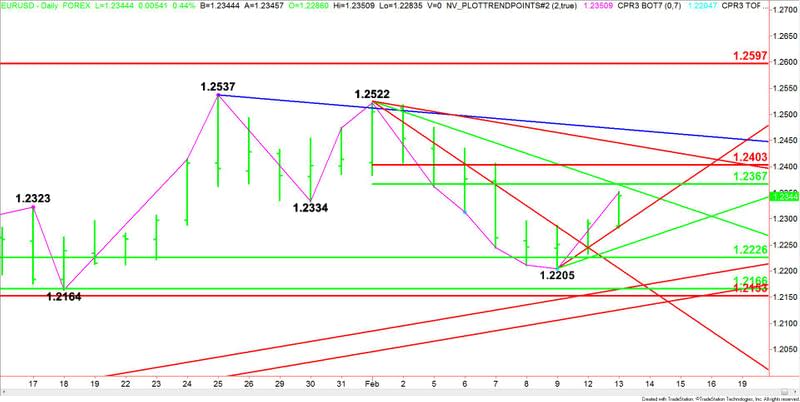
A trade through 1.2205 will negate the closing price reversal bottom and signal a resumption of the downtrend.
The support zone is a retracement area bounded by 1.2226 to 1.2153. Inside this zone is a major 50% level at 2.2166. Last week, this zone stopped the selling at 1.2205.
The short-term range is 1.2522 to 1.2205. Its retracement zone at 1.2367 to 1.2403 is the primary upside target. Since the main trend is down, we could see sellers show up on the first test of this zone.
Daily Technical Forecast
Based on the early price action, the nearest objective is a potential resistance cluster at 1.2362 to 1.2367. Watch for a technical bounce on the first test of this area.
Taking out 1.2367 could trigger a surge into 1.2403, followed by a downtrending Gann angle at 1.2442.
On the downside, the nearest support is an uptrending Gann angle at 1.2285. This is followed by another uptrending angle at 1.2245.
Watch the price action and read the order flow on a test of 1.2362 to 1.2367. Trader reaction to this area should determine if the buying is getting stronger.
This article was originally posted on FX Empire
More From FXEMPIRE:
E-mini NASDAQ-100 Index (NQ) Futures Technical Analysis – February 13, 2018 Forecast
S&P 500; US Indexes Fundamental Daily Forecast – Rising Rates Have Investors on Edge
E-mini S&P 500 Index (ES) Futures Technical Analysis – February 13, 2018 Forecast
Price of Gold Fundamental Daily Forecast – Decoupling from Stocks, Bonds
Natural Gas Price Fundamental Daily Forecast – Prices Hovering Around December 21 Bottom at $2.532
